


Reasons Why The Cyclical Stocks Bull Market Will Continue
Stock-Markets / Stocks Bull Market May 12, 2011 - 04:59 AM GMTBy: John_Hampson

 1. Cyclical stocks bulls historically end when 10 year treasury yields exceed 6% - currently 3.2%:
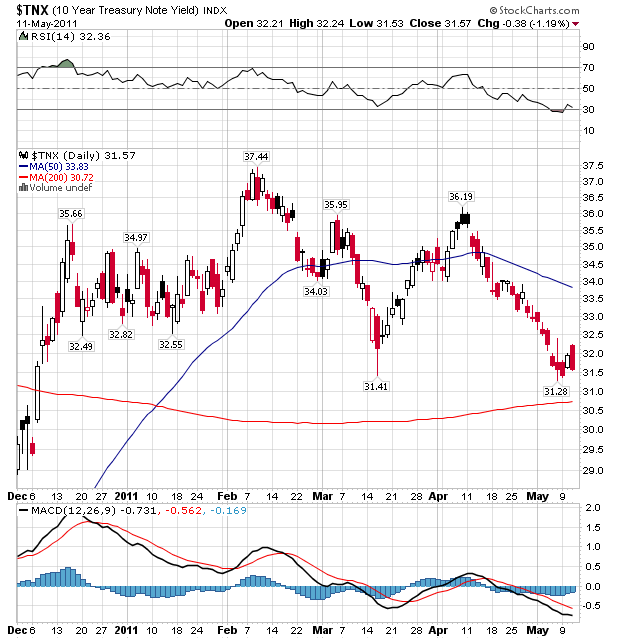
Source: Stockcharts
2. Cyclical stocks bulls historically end when the yield curve has become abnormal and predicts a recession - the yield curve is currently normal and predicting lower but positive growth ahead:
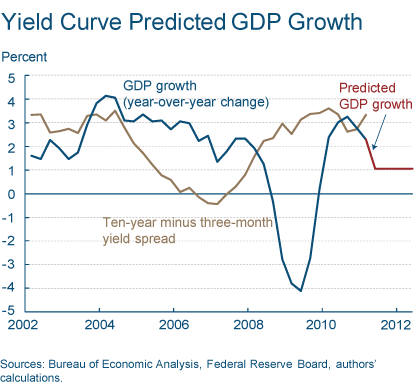
Source: Fed Reserve Bank Of Cleveland
3. Cyclical stocks bulls historically end with a negative divergence in breadth - currently breadth is supportive and not diverging:
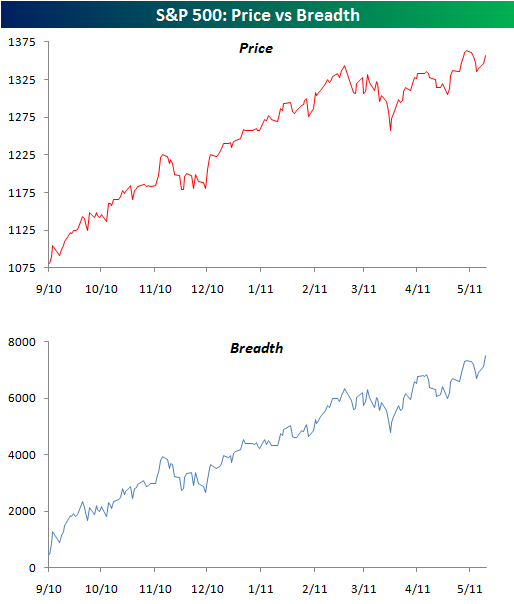
Source: Bespoke Investment
4. Cyclical stocks bulls historically end when official inflation exceeds 4% and we reach overtightening of interest rates - inflation is accelerating and is a warning flag (particularly in light of the official / unofficial statistics discrepancy) but currently receding oil and commodity prices are helping to release the pressure. Interest rates in the main global economies remain low and stimulating - some way from overtightening.
Source: Shadowstats.com
5. Money supply growth and money velocity support a cyclical stocks bull continuation - both are positive and the chart below shows the real and nominal money supply for the G7 countries are both healthy:
Source: Thomson Datastream / Moneymovesmarkets.com
6. OECD leading indicators point to global growth - note the overall picture is bright but there are differences between nations: USA, China and Germany leading indicators are particularly strong, whilst India and Brazil have turned negative.
Source: OECD
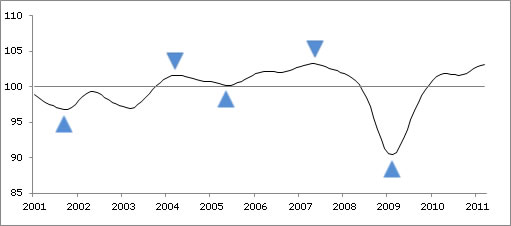
7. ECRI leading indicators for the USA continue to point to strength ahead - note there has been a flattening in the last couple of weeks but they still show a strong reading:
Source: Dshort.com / ECRI
8. Earnings continue to beat estimates (note that although the current earnings season has a lower beat rate than preceding quarters, still more companies are beating than disappointing) and equities remain relatively cheap to other assets and relative to history - trading at 13.5 times earnings projections for this year compared to 15 historically:
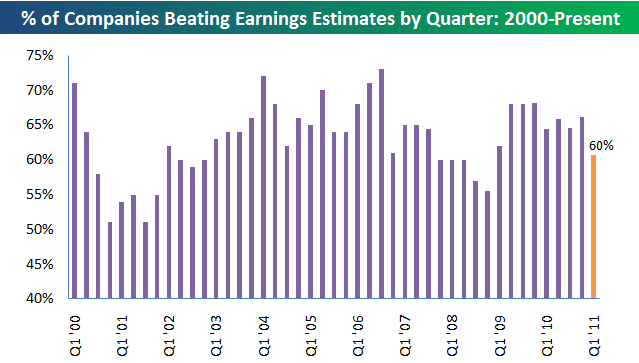
Source: Bespoke Investment
9. Bloomberg Financial Conditions Index is positive:
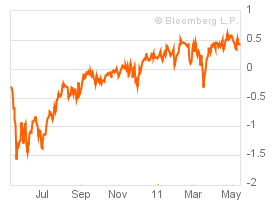
Source: Bloomberg
10. The stock market is a leading indicator and remains in an uptrend. Dow Theory also remains supportive:
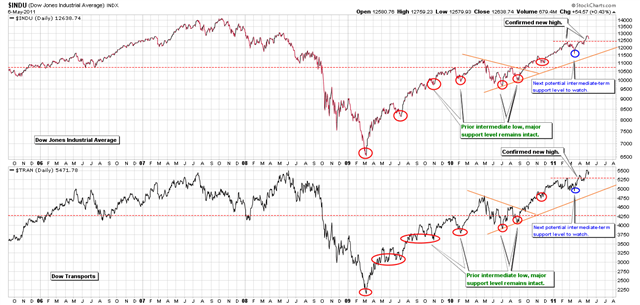
Source: Portfolio Tilt
11. Seasonality is supportive - the US Presidential cycle pre-election year (which is 2011) has historically been a sweetspot for equities, particularly into early September:
Source: Seasonalcharts.com
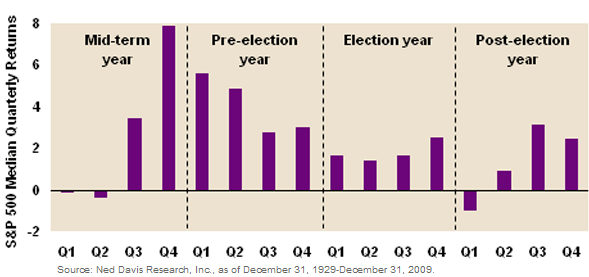
Source: Traders Narrative
Quantitative Easing 2 is ending the last day of June, and some assume this prospect will pull the rug from under equities. But until then we have a full programme of stimulus - the latest POMO schedule has been released covering May 12 to June 10 and represents £93 billion in market purchases, similar to recent schedules. Furthermore, thereafter the Fed will reinvest maturing securities until further notice, making a continued partial stimulus. And only after that will the Fed then consider a rate rise. In short, Fed policy remains supportive of higher asset prices, despite full QE ending in June.
Comparing the current bull with historical bulls, this cyclical bull is likely to last from 2009 through to 2013, and based on average gains this second quartile would see us at around 1280 by June, implying a little pullback here would be normal. Based on averages and the internals of this bull so far, the cyclical bull would then advance a further 50% before finally rolling over in 2013. This fits well with time needed to work through a cycle of interest rate rises to overtightening, treasury yields to double and other typical cyclical bull ending criteria to be met.
Were such events to unfold much quicker, or positive economic feedback looping to sharply reverse, then the above measures and indicators would flash warning signs in advance. Until then, the amalgamated forecast is clear: the stocks cyclical bull will continue.
John Hampson
John Hampson, UK / Self-taught full-time trading at the global macro level / Future Studies
www.amalgamator.co.uk / Forecasting By Amalgamation.
© 2011 Copyright John Hampson - All Rights Reserved
Disclaimer: The above is a matter of opinion provided for general information purposes only and is not intended as investment advice. Information and analysis above are derived from sources and utilising methods believed to be reliable, but we cannot accept responsibility for any losses you may incur as a result of this analysis. Individuals should consult with their personal financial advisors.
© 2005-2022 http://www.MarketOracle.co.uk - The Market Oracle is a FREE Daily Financial Markets Analysis & Forecasting online publication.