


Stock Market Odds Favour a Rise to SPX 1420 Before the Next Correction
Stock-Markets / Stock Markets 2011 May 09, 2011 - 03:43 AM GMTBy: Andre_Gratian

 Very Long-term trend - The continuing strength in the indices is causing me to question whether we are in a secular bear market or two consecutive cyclical bull/bear cycles. In any case, the very-long-term cycles are down and, if they make their lows when expected, there will be another steep and prolonged decline into 2014-16.
Long-term trend - In March 2009, the SPX began a move which evolved in a bull market. Cycles point to a continuation of this trend for several more months.
SPX: Intermediate trend - The SPX has met its 1370 projection and is consolidating. The odds still favor a rise to the next logical target of the low 1400s before the beginning of an intermediate correction.
Analysis of the short-term trend is done on a daily basis with the help of hourly charts. It is an important adjunct to the analysis of daily and weekly charts which discusses the course of longer market trends.
Market Overview
For the past two weeks, I have stressed that oil, gold, and the dollar were reaching significant Point & Figure targets. It turned out that these projections were only off by a fraction. Here were the projections, the actual price reached, and Friday's closes.
| Oil (WTIC) | Gold (GLD) | Dollar | |
| Projections: | 115 | 153-154 | 74 |
| (P&F counts) | 154-156 | ||
| Reversal price: | 114.88 (5/2) | 153.61 (5/2) | 72.69 (5/4) |
| Price on 5/6: | 97.33 (lo 94.77) | 145.30 (lo 143.47) | 74.92 (hi 74.93) |
I also had a target of 1370 for the SPX. The high on 5/2 was 170.58, before the correction started. So far, the low for the decline has been 1329.17, and it closed the week at 1340.20.
I am supplying these figures for a couple of reasons: first, to illustrate the immense value of using P&F analysis, and second, to show that these wild price swings may indicate that the stock market is at an important juncture.
Based on the accumulation pattern that was created during the correction into mid-March, there are higher potential P&F targets for the SPX. Also, that correction formed a H&S configuration which has been validated by a clear break-out above the neck line. The normal projection for this H&S pattern closely matches the more liberal count taken across the P&F base.
The pull-back which occurred last week could simply be a deeper than normal return to the H&S neck line. However, the severe corrections in commodities suggest that this is more than a minor consolidation, and it creates some doubt about the ability of the SPX to reach its higher targets.
By the same token, we will see that sentiment is still not suggesting that we are at an important top. This leaves us with a greater than normal challenge to determine the future course of the market. Let's turn to the charts and see if we can derive some technical clues which will clarify its current position.
Chart Analysis
We'll start with the Weekly SPX Chart, because it tells the story of the market very clearly -- past, present, and future!
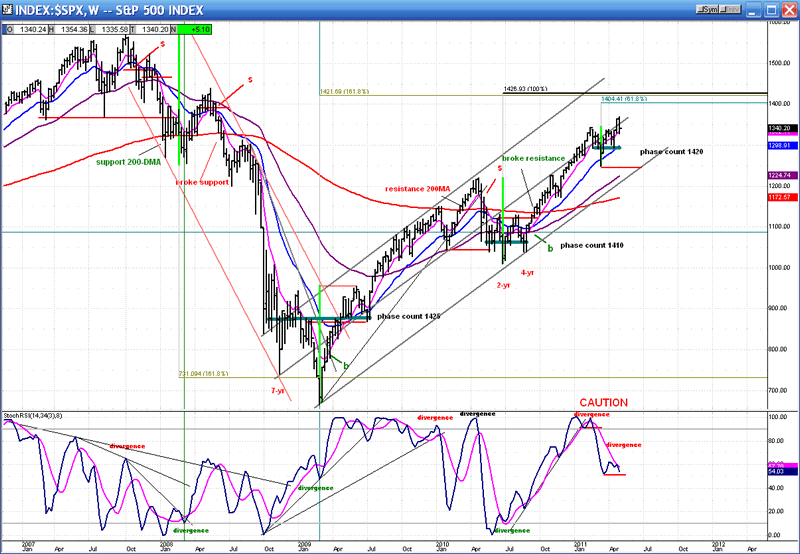
After the index made a top in October 2007, there was a brief, but potent bear market which created a lot of economic havoc from which we are still recovering. This bear phase was completed at 666.79 on March 6, 2009. Like the Phoenix, the SPX rose from economic devastation giving birth to a new bull market which is still intact.
There are some things worthy of noting on the chart. The 200-wk MA (red) offered brief support to the nascent bear market, and when it was broken decisively, the index plunged rapidly into the lows of the two cycles which were, in part, responsible for the decline. There was an attempt at reversing from the 1.618 extension of the first wave down. However, the bottoming of the second cycle took it a short distance past that target a second time before a bona fide reversal took place.
The new bull moved out of its bear channel, and continued to rise until it met with the 200-wk MA once again. Although its momentum pushed it above for a few points, it had to retract and spend some time consolidating below the MA before breaking through decisively on the second attempt. Since then it has continued to make new highs, the last one being on 5/2 at 1370.58.
That takes care of the past and present. What about the future? Based alone on price projections, it appears that we are not quite ready for the next intermediate top. A Fibonacci projection of 1.618 from the top gave us a pretty accurate target for the bear market low. Using the same measurement on the upside (1.618 of the first up-wave) we come up with 1421.69. Additional (slightly different, but valid) Fibonacci projections from the two higher correction levels for July 2010 and March 2011, give us 1426.93 and 1404.41 respectively.
These projections alone should warn us not to expect an important top until we get into the low 1400s. "But that's not all!" The potential validity of these Fibonacci targets are enhanced by the P&F projections which are marked on the chart. From the 2009 base, we obtain a phase count to 1425. Across the July 2010 correction, we come up with a confirming phase projection of 1410 and, counting across the recent March consolidation on the P&F chart, we have another confirming count to 1420.
These Point & Figure projections were made possible by the 3X5 charts provided by StockCharts.com. My own 1X1 chart of the SPX gives me counts to 1405 and 1435.
Although there was a very accurate (oft mentioned) target to 1370 that has now been confirmed by a healthy decline of 41 points giving the appearance of being the start of something nastier, the higher projections retain my attention. It is possible that our current correction is not over, but an important decline does not appear to be in the cards at this time.
There are other technical factors which support this view, and we'll cover them later on. But for now, let's skip the daily chart which is unnecessary for our analysis, and go directly to the Hourly Chart. It should help us determine what needs to happen to end the current decline.
This chart shows the entire uptrend from 1249, delineated by the green channel lines. The first phase ended just a little higher than the 1334 projection. The second phase, which was completed last week, ended right at the 1370 target. We cannot say for sure (yet) that the decline from the top is over, although the SPX has clearly come out of its down channel, and has now ended its downward progression of lower highs and lower lows. By rising above 1348 on Friday, and finding support as it back-tested the top channel line, the trend has presumably turned back up, but it is much too soon to say for sure.
Other factors contributed to Thursday's reversal. The index found additional support from its 200-hr MA and, even more important, it met the P&F to 1330. The 1370 top took the form of a small H&S, and the count across the shoulders on the P&F chart suggested that 1330 was a likely target for the low. There were two other ways to confirm that projection, and this gave it a high degree of probability. Of course, the break-out of the downtrend came as a result of the better-than-expected jobs report on Friday morning. Or was it because the P&F target was met? Or was it because the index found support on the 200-hr MA? Or...? It's amazing how various, seemingly unrelated, factors come together in a way that defies comprehension. But it happens frequently. Nevertheless, although I was aware of other factors pointing to a potential reversal, I did not have the confidence to give a buy warning ahead of the unemployment figures.
Although all the indicators have given a buy signal and the index has come out of its down channel, the selling that took place after the peak of the rally, on Friday, was severe enough to cast some uncertainty on whether or not we had had a true reversal, and we'll have to wait for a little more proof that we are now ready to move to the 1400+ projections.
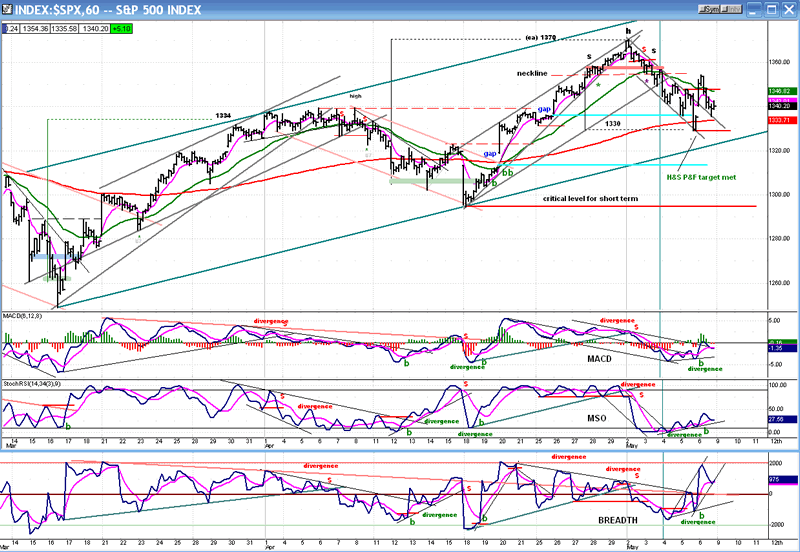
I mentioned earlier that there were some technical factors that supported this possibility. First of all, Friday's price action was potentially bullish. We have reversed the steady progression of new lows. If Thursday's low holds and we resume the uptrend and surpass Friday's high of 1354 with good confirming numbers from the A/D, we can be fairly certain that the uptrend has resumed. If we make a new low, we'll have to re-evaluate.
For additional bullish evidence, let's move on to the following portions of the newsletter.
Cycles
I have previously spoken of a 14-15-wk high-to-high cycle which has shown good regularity since the beginning of the bull market. The next high is due approximately at the end of May. This would be a great time to end this move in the low 1400's.
In the near-term, there is also a 13-wk cycle which should make its low in the week of May 23 and may influence the uptrend before we get to the end of the month.
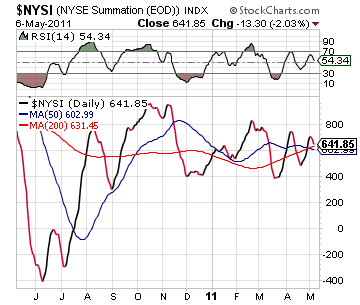
Breadth
The NYSE Summation Index (courtesy of StockCharts.com) has held up very well since the beginning of the rally, and it is still moving up. The RSI is not overbought, allowing for a continuation of the up-move until it is.
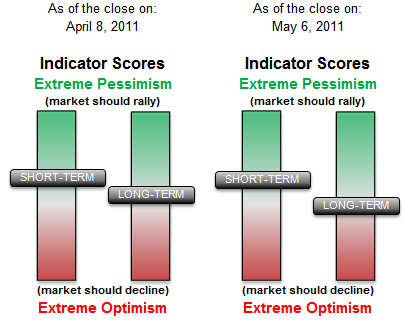
Sentiment
You don't see this very often! The SentimenTrader (courtesy of same) is almost exactly where it was two weeks ago. The reading on the short-term indicator is bullish and, based on past experience there is still some room for the market to move up before we make a significant high.
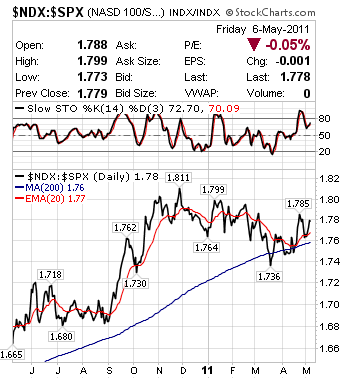
NDX/SPX ratio
More evidence that we could more higher! In an uptrend, the NDX tends to lead the SPX. This is what it is doing presently, and it has been doing this since the March lows. You can see this plainly on the chart below, courtesy of StockCharts.com
The NDX normally loses its relative strength to the SPX as we get close to a top. We should wait for this to take place before deciding that we have reached the high of the rally from 1249 -- which may also be the high of the move from 1011.
Dollar index
This is what I wrote last week: The dollar index had a target of 74. It went beyond it to 73. In a climactic terminal move, this is acceptable. For a bona fide reversal, it will have to start pulling away from its low right away.
The UUP (dollar ETF) met its projection right on the nose and was only off a fraction from its Fibonacci projection.
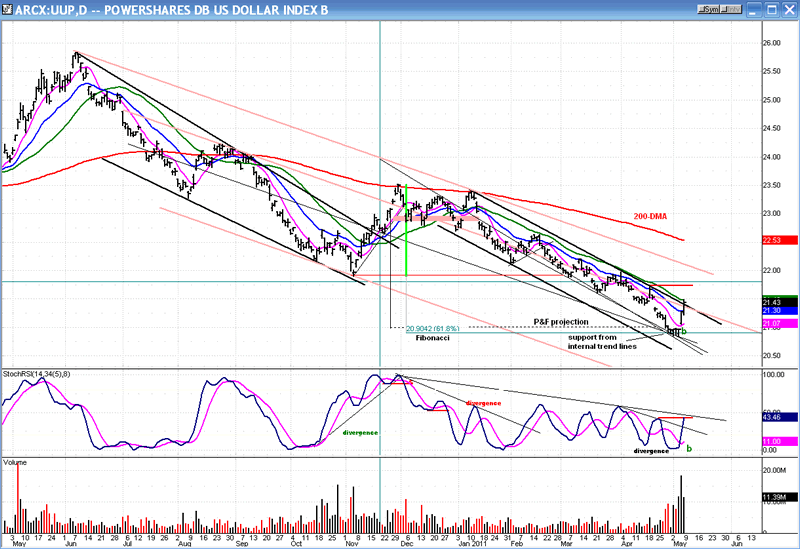
The rally has reached the top channel line of the smaller channel. It's possible that this is all you get for now and that some consolidation ensues before it moves higher. Considering the volume pattern, I think it's a pretty safe bet that the dollar has reached an important low. However, there is a base to build on the Point & Figure chart, and this may take a little while.
Gold
This is a Weekly Chart of GLD which spans a little over two years, and includes the massive H&S formation which it made between early 2008 and mid-2009. From this formation, on a P&F chart we can draw some very important information which will allow us to peer into gold's present and future behavior.
There are three levels from which we can take counts. The most conservative one, at the 84 level, had a maximum projection to 145 which might have brought about a temporary correction had not frenzied buying in the precious metals caused a buying climax all the way to the next projection of (ca)154 from which prices promptly collapsed.
The next count, taken at the 86 level (the right shoulder of the H&S formation), has a phase count to 154-156. This was reaffirmed by the last re-accumulation pattern which projected 153-154 where the feeding frenzy halted, but probably only temporarily, because the entire 86 base has a maximum projection to 212-219. Since there is no sign of long-term deterioration in the price chart, it is probable that these numbers will be seen at some time in the future.
Finally, we can make a case for a count taken across the 93 line from which we can derive a final target of 232. Some analysts are expecting the price of gold to eventually reach 5,000! This would approximately double the maximum count shown on this chart. I don't have a good chart to evaluate the potential of the base which formed over the ten years starting in 1977, so I can't pass judgment on this projection.
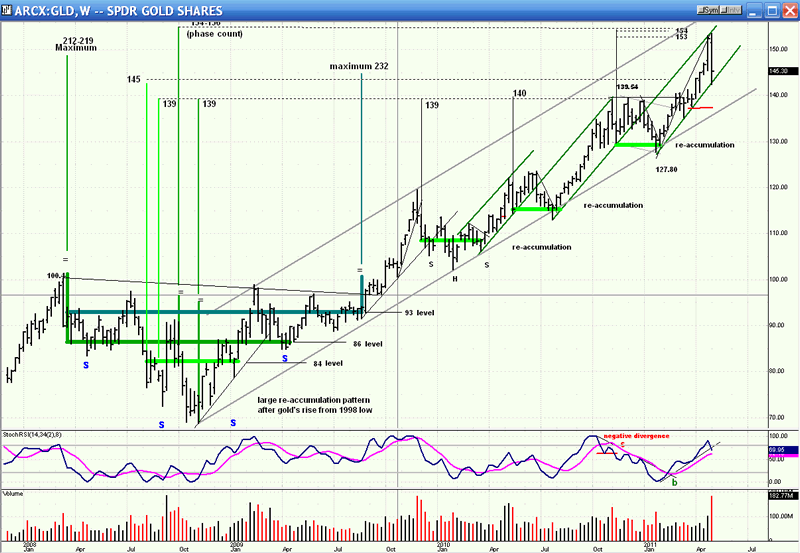
After last week's action, GLD is probably entitled to a good rest, but it is likely to have some sort of a bounce as it re-tests the validity of last Monday's high. This would lift the pressure off the SPX and allow it to reach its own projections in the low 1420s.
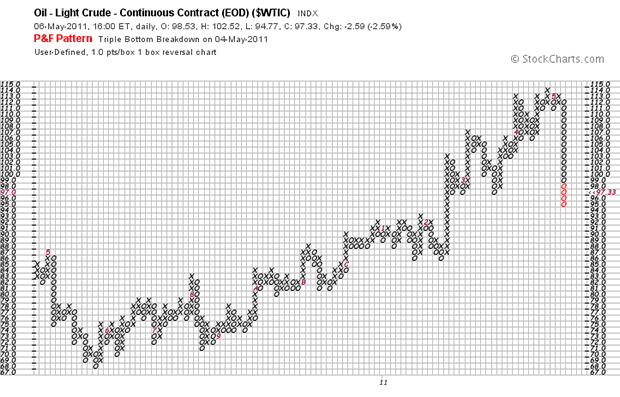
OIL
Crude did not want to be left behind and joined other commodities in their mini-crash, giving up 17% of its value in four days. In my last report, I had written: "Last week, crude oil crept up a little closer to its 115 target" and let it go at that. I have been forecasting a reversal at 115 for several weeks. The correction may already have met its downside target which was conservatively estimated to be 95. There is also a potential for 91 which seems more likely.
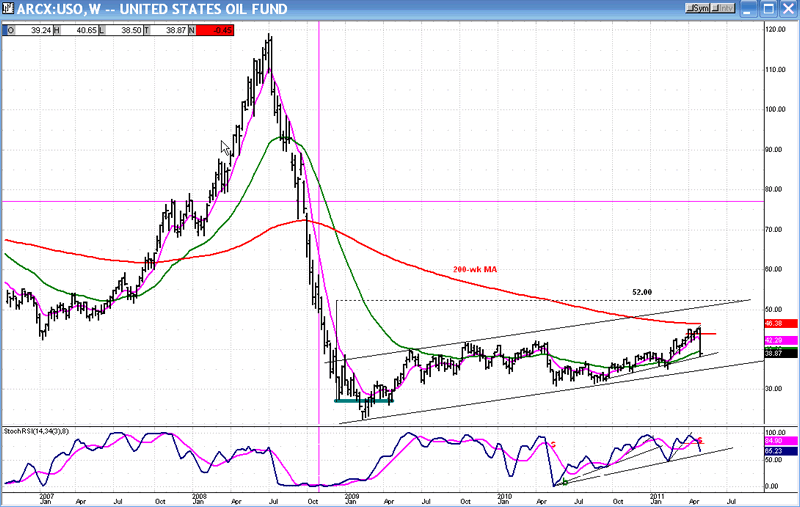
A Weekly chart of USO, the oil ETF, follows that of WTIC. I am showing it to make a couple of points. The phase projection for USO was 46, which corresponds to 115 for WTIC. The reversal came at 45.50. But even if you did not know about the P&F projection, lookie where the index reversed! Right at its indomitable 200-wk MA!
The move to 46 was only a phase projection. The entire base (drawn in green) has the potential to take the index to 52. That won't happen tomorrow, but when that price is reached, we will probably see $130 crude!
A conservative count taken across the 2009 base on the WTIC chart matches that projection.
Summary
Last week's summary was: "I have provided extensive analyses of the dollar and gold, because both appear to be reaching a reversal point and readying to enter a corrective phase.
SPX may also be ready for a correction, but only near-term. It has a projection to about 1370 before this phase of the uptrend comes to an end."
So far, the analysis about reversal points has been proven precise. We still need to determine whether the SPX has made a near-term low to be followed by a final move to the low 1420s, or if we have started a more lasting correction.
FREE TRIAL SUBSCRIPTON
If precision in market timing for all time frames is something which is important to you, you should consider a trial subscription to my service. It is free, and you will have four weeks to evaluate its worth.
For a FREE 4-week trial. Send an email to: ajg@cybertrails.com
For further subscription options, payment plans, and for important general information, I encourage you to visit my website at www.marketurningpoints.com. It contains summaries of my background, my investment and trading strategies and my unique method of intra-day communication with Market Turning Points subscribers.
By Andre Gratian
MarketTurningPoints.com
A market advisory service should be evaluated on the basis of its forecasting accuracy and cost. At $25.00 per month, this service is probably the best all-around value. Two areas of analysis that are unmatched anywhere else -- cycles (from 2.5-wk to 18-years and longer) and accurate, coordinated Point & Figure and Fibonacci projections -- are combined with other methodologies to bring you weekly reports and frequent daily updates.
“By the Law of Periodical Repetition, everything which has happened once must happen again, and again, and again -- and not capriciously, but at regular periods, and each thing in its own period, not another’s, and each obeying its own law … The same Nature which delights in periodical repetition in the sky is the Nature which orders the affairs of the earth. Let us not underrate the value of that hint.” -- Mark Twain
You may also want to visit the Market Turning Points website to familiarize yourself with my philosophy and strategy.www.marketurningpoints.com
Disclaimer - The above comments about the financial markets are based purely on what I consider to be sound technical analysis principles uncompromised by fundamental considerations. They represent my own opinion and are not meant to be construed as trading or investment advice, but are offered as an analytical point of view which might be of interest to those who follow stock market cycles and technical analysis.
Andre Gratian Archive |
© 2005-2022 http://www.MarketOracle.co.uk - The Market Oracle is a FREE Daily Financial Markets Analysis & Forecasting online publication.