Financial Crisis Next Wave, The Consequences of QE2
Stock-Markets / Credit Crisis 2011 May 09, 2011 - 02:58 AM GMTBy: Submissions
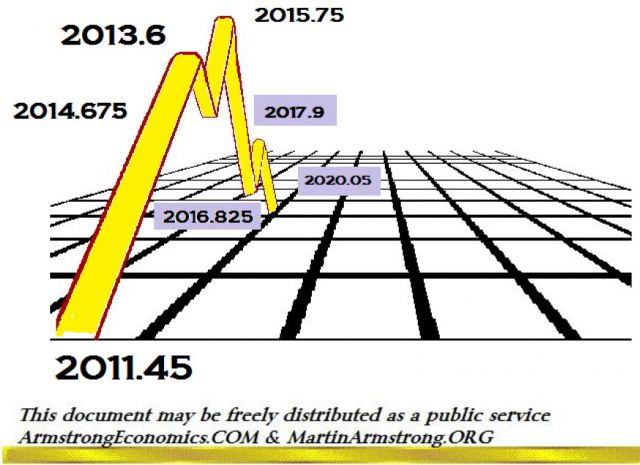
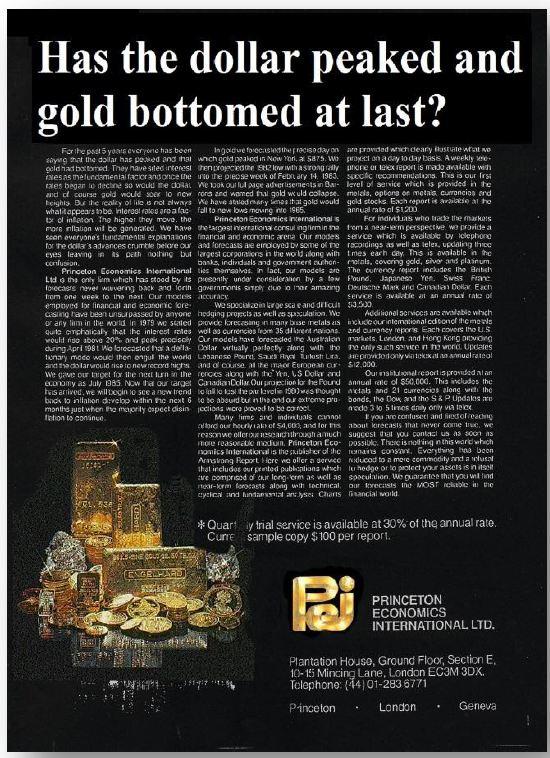
 Martin A. Armstrong writes: We are approaching the end of this current 8.6 year wave come June 13th, 2011. What awaits us on the other side is a change in the overall trend. When we approached the same turning point in 1985.65, PEI took full page advertisements and ran them on the back of the English magazine, the Economist for 3 of the 4 weeks that month. Therein we warned that there would be a change back to inflation and that the steep economic decline that followed the insane peak in interest rates during 1981 was over. Now as we approach this same period after a tumultuous 4.3 years down that saw the collapse of real estate, the demise of legendary firms such as Lehman Brothers and a score of bankruptcies that followed, if anything, these past 4.3 years have certainly not been but boring.
Many people lost their retirement savings or had them seriously curtailed. The involvement of group trading witnessed a catastrophic economic contagion that swept the world taking many countries down with it such as Ireland and Iceland. But these things are nothing new. The banks had to be bailed out on the loans to South America, Russia, Long-Term Capital Management, S&L Crisis, and now the Mortgage backed debt derivatives. Looking at their track record post 1971, one wonders if they ever get it right and they clearly all flock together magnifying their mistakes relying on the sure bet of government bailouts.
.jpg)

Above is a perpetual chart of US government bonds we use to publish. This is based upon a view of price rather than yield. We can see that just after OPEC began in the early 1970s, investing in US debt has been anything but a good long-term investment. But the cold hard face of reality, warns that no country’s debt has offered a mirror image. Indeed, what prompted Standard and Poors to signal a danger to the credit rating of the United States was based upon IMF data showing the US deficit reached 10.6% of GDP. The US Congressional Budget Office puts that at 8.9%. Just as the Chinese Credit Rating Agency downgraded US debt and it was ignored saying “oh that’s China,” well the major credit rating agencies are American. Do you really think they would dare to downgrade US debt and live to talk about it?
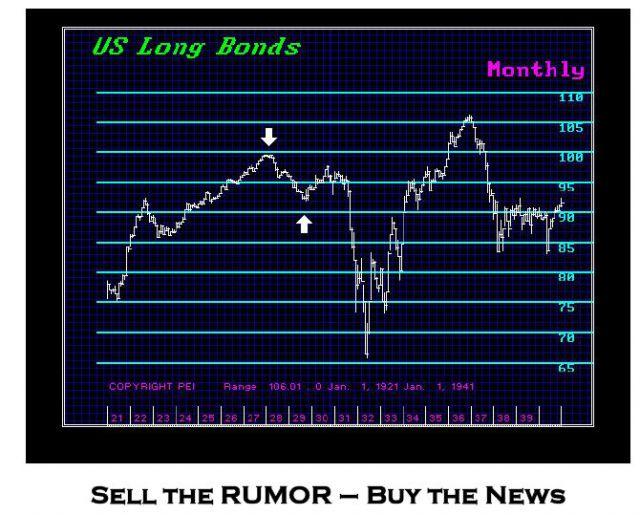
Here is a chart of the US Long Bonds covering the Great Depression and Postwar period. Notice that the bonds collapsed on fears in 1931 that everyone else defaulted on their national debts except France so it became widely anticipated the US would do the same. Clearly the Federal Government did not default. Nevertheless, as you can see, ANTICIPATION of a POSSIBLE risk of default wiped out the bond market purely upon expectations that did not materialize. And this was a period when the government was not in trouble and had chronic BALANCED budget surpluses. That is what prompted John Maynard Keynes to argue in times when DEMAND collapsed, government should take up the slack by deficit spending to stimulate that DEMAND.
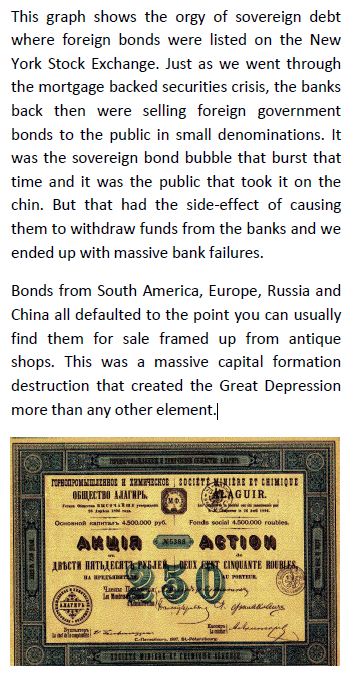
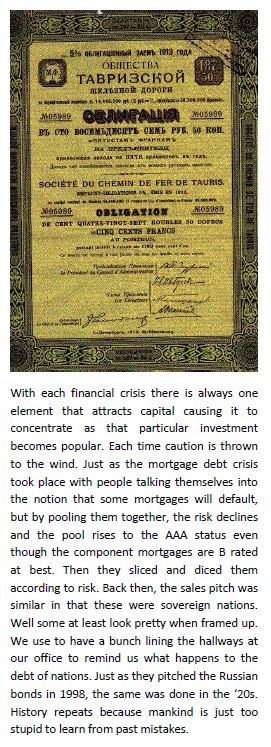

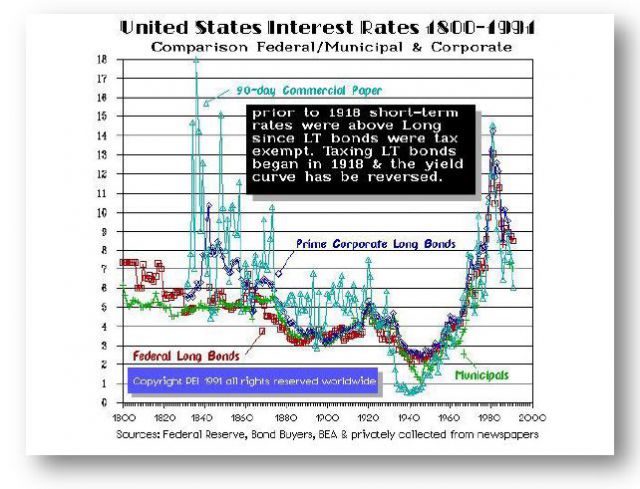
Here you will see the yields overlaid of the four primary general debt categories. We have the municipal and federal debt interest rates along with 90-day Commercial Paper and Prime Corporate Long Bonds. Note that the municipals were lower yields than federal in 1800 because the confidence back then was more in the state and local levels distrusting the new federal government. By the 1830s, you will see the introduction of corporate debt. There was the spike high with the Panic of 1837 and spikes with the Panic of 1857 running into 1873. This Panic of 1873 shifted the Financial Capital of the United States from Philadelphia to New York City. Now notice as the Great Depression manifested, the aftermath of the sovereign debt crisis brought with it a shift to corporate paper being viewed as safer. The 90-day commercial paper fell to the lowest rates of the
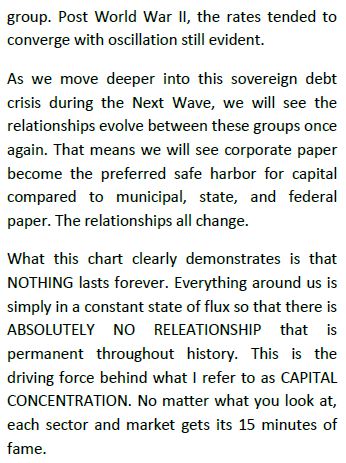
The variables are extraordinarily complex. There are so many that exist that it’s impossible to keep track of so many without a massive computing effort. It is just not so easy to break it down to a single cause and effect. Once a trend is set in motion, what we are looking at is a bunch of markets and indicators flipping so that the forecast for the long-term actually becomes easier than tomorrow. You can’t turn a battleship around like a speedboat. That is what the long-term becomes easier to see because it cannot change direction on a dime.
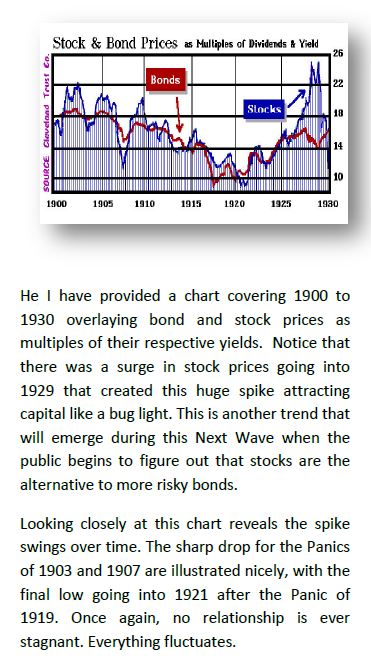
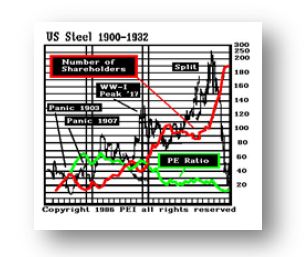
Additionally, here is a chart of US Steel a leading stock during the Roaring ‘20s. Notice the ever rising red line reflecting the number of shareholders. This rises and the PE Ratio declines into the major high. Once more, this shows key trends that need to also be watched to distinguish big bull markets and shifts in domestic capital concentration.
Perhaps you are now getting a sense of what our model was tracking; EVERYTHING that ever moved. The economy is a vast complex and dynamically adaptive self-referral network interlinked on a global scale most have yet to fathom. If it moved, we grabbed it, threw it into the microwave to see what it would taste like. This was done on a massive global scale. We are far beyond RSI, moving averages, and stochastics here. Once you begin to see the dynamic structure, understanding how it unfolds is truly an enlightening experience.
In reality, there are correlations between many individual trends that are spectacular. You begin to see how groups really react and the trend unfolds before your eyes so you can see the future manifest in such a manner that there is no other solution. The future becomes verifiable as interrelated links confirm each other.
.jpg)
So we are approaching the nadir on the Economic Confidence Model. There is really no one Behind the Curtain who does not realize it’s a cycle. You probably can find an obscure book at the Foundation For the Study of Cycles by Paul A. Volcker, former Chairman of the Federal Reserve, entitled Rediscovering the Business Cycle published in 1978. So those who want to pretend cycle theory is somewhere out in left field, are either on a disinformation campaign or are really uninformed. The Bureau of Economic Analysis (BEA) seasonally adjusts data and that means they are smoothing the data to try to remove the spike highs and lows of the cycle.
Understanding that we face a very important change in trend on June 13th, 2011 (2011.45) is vital to our future. There is no chance in hell that everyone would ever follow one cycle. I personally believe it is a growing process. In our younger years, we take our losses and perhaps buy the high. After such a fiasco, we learn our lesson and become more cautious. A good trader values his losses more than his wins. This might sound stupid, but wins are a celebration, rarely time for reflection. A loss contains VALUE. You paid for it dearly. Learn why you made your decision and strive to implement that new costly knowledge. In this wave, we give meaning to that phase – Ah to be young again; but with what I know today!
So what we have to comprehend is that as illustrated just above, there are normal business cycle patterns that are distinct with clear traits,
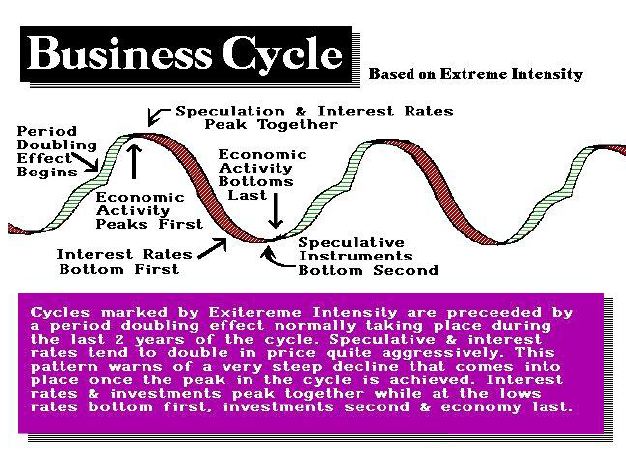
and then there is the rogue tsunami wave. This is the wave that creates the Bubble Tops and reflects deep capital concentration. This is the wave formation that brings the house down. This is the wave that hit in 1929, and in Tokyo in 1989. It is the spike wave that is a PHASE TRANSITION whereby there is a price doubling in the last stage. We even saw this in gold and silver going into 1980. Gold rallied from $103 to $400 between 1976 and 1979. Then in the last few moments, gold blasted from the $400 level in December 1979 peaking at $875 on January 21st, 1980. We saw a similar pattern doubling in price in the Nikkei 225 in Tokyo.
These are patterns that are typical and universal. They are incredibly important to understand for they are the difference between emotional forecasts and real forecasting. If you do not have the experience, it is hard to see things rationally in times of such extreme price movements. At a seminar in Tokyo a private
individual bribed hotel staff to get into our institutional conference. He later made his way up afterwards and told me how he got in and was desperate to ask me advice. He was in his 60s and had bought the Nikkei on the day of the high in 1989. He then told me he had NEVER invested in stocks his entire life. I was now captivated. I asked him why he bought on that day. He told me brokers had called him every year for the past 7 years telling him every January they market rallied around 5%. He said he watched their predictions every year pan out. So he gave in and invested about $50 million. The Nikkei fell about 40% and he still had the position because he kept waiting for it go back up to get out at a break-even. Those spike highs on this PHASE TRANSITIONS represent such highs because everyone who EVER thought about buying, has bought. There are no buyers left. Scare that herd, and you have a stampede that is unprecedented.
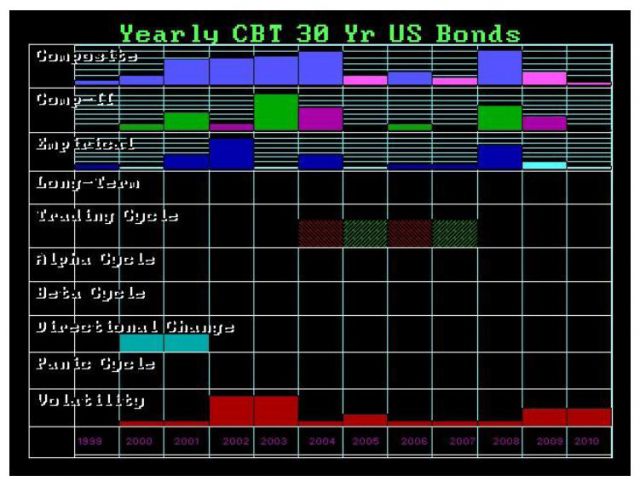
When we look back at the last forecast array generated by the computer, the top line is the composite of all the various models employed at the time. The main turning points were 2000, 2004, and 2008 when generated back in 1998. As we can see from the chart provided, these main targets were very critical. The 2002 high came in nicely on the Empirical Model and then the next strongest target back
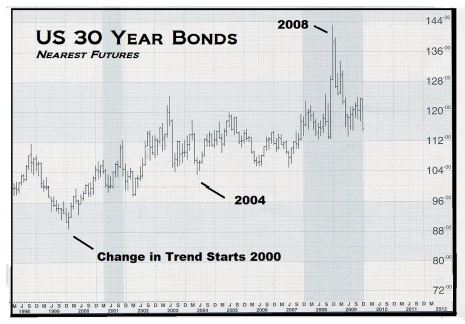
then appeared out 10 years forward in 2008. I have been asked: How can a computer project so far in advance? To answer that question, long-term trends are set in motion and become self-fulfilling for they are also self-referral drawing on the past. You simply cannot change the long-term consequences of accumulative actions over decades. We all know you cannot live forever on a credit card and never make payments or work. Governments are the same.
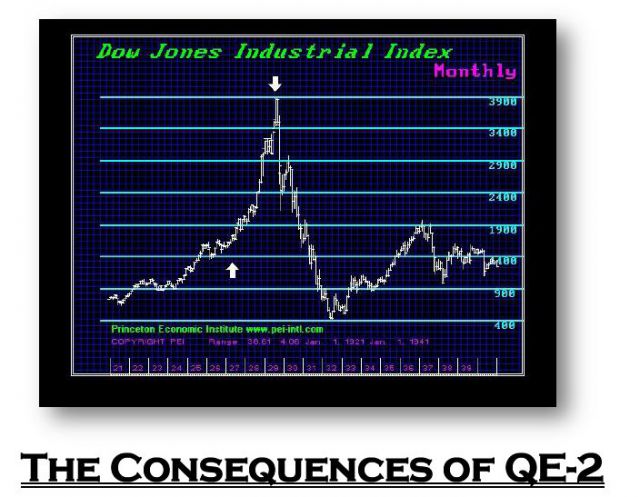
No matter what people think, there are always two sides to every coin. The consequences of QE2 may indeed prove to be the same as those that have manifested from the Japanese government intervention that created: The LOST QUARTER CENTURY. While it may sound good to intervene and try to support the economy in periods of sharp decline, this type of action also has its negative side. What happened in Japan was outrageous. Indeed, the road to hell is paved with good intentions. This is what happens when the government believes (1) it has the power and (2) the obligation to intervene without any understanding of the consequences of its own actions.
Once a government intervenes, they are trying to manipulate the economy and markets. That CANNOT be done on a long-term basis. In Japan, the economy got worse because foolish corporations held on to their portfolios believing that the markets would not continue lower because of the government intervention. Had they simply liquidated their positions, the decline and fall would have been much shorter in duration just as the Great Depression. As illustrated above, there was no intervention DIRECTLY. There was manipulation of interest rates being lowered to try to stimulate demand and senate investigations that led to the creation of the SEC. But there was no DIRECT intervention as took place in Japan, Long-Term Capital Management (1998), or with TARP, and QE2. Direct Intervention appears to PROLONG the economic upheaval, NOT shortening it at all.

Source : armstrongeconomics.files.wordpress.com/2011/04/armstrongeconomics-the-next-wave-042411-update.pdf
Copyright © 2011 Martin A. Armstrong - All Rights Reserved Disclaimer: The above is a matter of opinion provided for general information purposes only and is not intended as investment advice. Information and analysis above are derived from sources and utilising methods believed to be reliable, but we cannot accept responsibility for any losses you may incur as a result of this analysis. Individuals should consult with their personal financial advisors.
© 2005-2022 http://www.MarketOracle.co.uk - The Market Oracle is a FREE Daily Financial Markets Analysis & Forecasting online publication.


