


U.S. Economic Data to Ponder About Before the April Employment Report
Economics / US Economy May 06, 2011 - 01:52 AM GMTBy: Asha_Bangalore

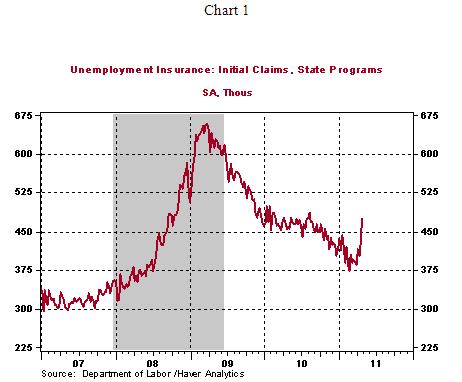
 The April employment report is scheduled for publication Friday, May 6. An increase of 190,000 payroll jobs and a steady reading for the unemployment rate (8.8%) is our forecast. The consensus forecast is an increase of 200,000 jobs and an unchanged jobless rate. Nonfarm payrolls increased 216,000 in March, with the private sector accounting for a gain of 230,000 jobs. Private sector hiring has risen at an impressive clip in the February-March period (average of 235,000 jobs). Against this backdrop, the jobless claims numbers for the week ended April 30 were unexpected. Initial jobless claims rose 43,000 to 474,000 and the prior week's estimate was raised to 431,000 from 429,000.
The sharp increase in initial jobless claims reflects three one-off factors. Auto plant shutdown related to supply issues, due to the Japanese tsunami and earthquake, accounted for a part of the increase in initial jobless claims. The state of Oregon changed the extended benefits program which enabled new claimants. According to the Department of Labor, both these factors made relatively smaller contributions to the overall increase in initial jobless claims compared with the jump in claims in the state of New York. A large number of claims due to administrative factors in New York raised the total number of seasonally adjusted claims. Continuing claims, which lag initial jobless claims by one week, increased 74,000 to 3.733 million. All said, these readings will not have any bearing on the April employment numbers because the survey period for the month's tally is April 10-16. However, unease about the labor market will not fade away in the near term and we need to see a quick reversal of the latest jump in initial jobless claims to reduce these concerns.
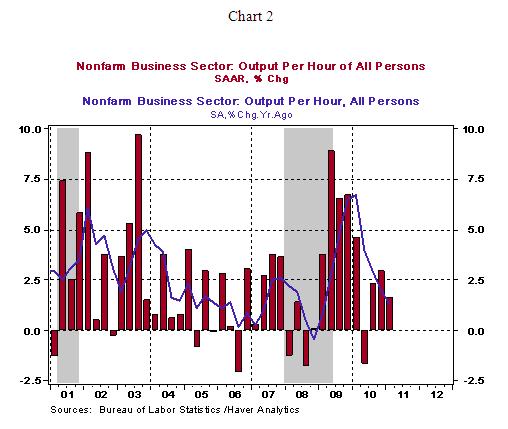
In related news, the productivity report for the first quarter shows a 1.6% annualized increase in U.S. productivity compared with a 2.9% gain in the prior quarter. On a year-to-year basis, there is a decelerating trend in place (see Chart 2). This is a cyclical feature which implies that productivity gains in the early stages of a recovery are expected, while a tapering off follows in the later stages of the business cycle. At the later stages of a business cycle, productivity gains are less supportive of economic activity, which leads to increased hiring to meet growing demand.
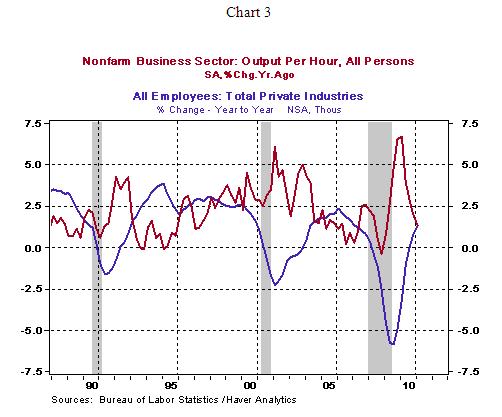
These aspects of the cyclical nature of productivity are visible after seven quarters of economic growth (see Chart 3). The decelerating trend of productivity suggests that payrolls should expand in the quarters ahead as demand conditions improve.
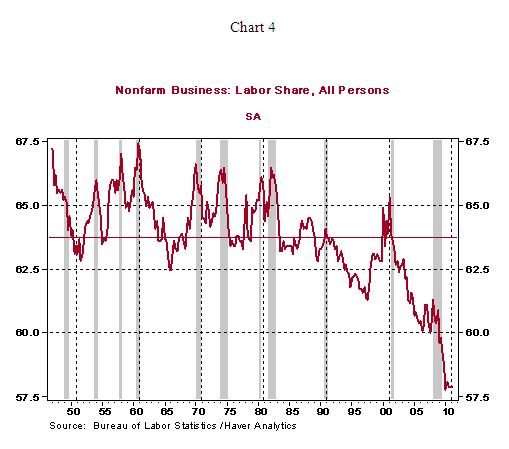
There is another aspect of the productivity report which is less cited. This report contains the share of labor in total output. In the first quarter of 2011, labor's share held steady at 57.9% compared with the prior quarter. But, it is significantly lower than the historical average of 63.7% (see Chart 4).
National income data offer other alternatives to measure labor's share in national output. Chart 5 depicts compensation to employees, from NIPA tables, as a percent of nominal GDP. In the first quarter of 2011, this measure of labor's share (54.5%) also held steady. It is noteworthy that this alternate gauge of labor's share also indicates drop from the historical average (56.6%) but the pace of decline is smaller compared with measure from the productivity report illustrated in Chart 4.
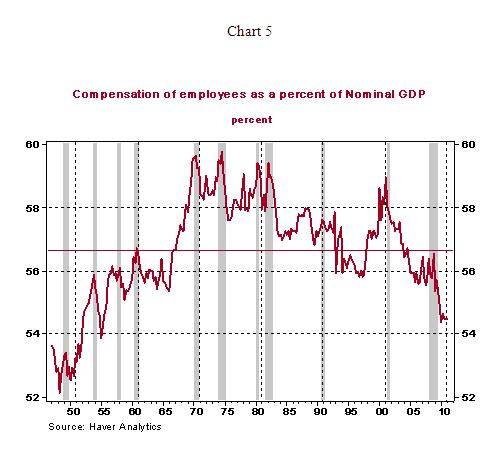
Comparing chart 4 and 5, there are two points to note and one question that stands out. First, the share of labor declines in the early stages of a recovery. Second, both measures of labor share in national output posted declines at the end of the 2001-2007 business expansion. The key question is if the share of labor income will revert to the historical mean as the current business expansion continues.
Asha Bangalore — Senior Vice President and Economist
http://www.northerntrust.com
Asha Bangalore is Vice President and Economist at The Northern Trust Company, Chicago. Prior to joining the bank in 1994, she was Consultant to savings and loan institutions and commercial banks at Financial & Economic Strategies Corporation, Chicago.
Copyright © 2011 Asha Bangalore
The opinions expressed herein are those of the author and do not necessarily represent the views of The Northern Trust Company. The Northern Trust Company does not warrant the accuracy or completeness of information contained herein, such information is subject to change and is not intended to influence your investment decisions.
© 2005-2022 http://www.MarketOracle.co.uk - The Market Oracle is a FREE Daily Financial Markets Analysis & Forecasting online publication.