GM and Ford Bullish Chart Patterns
Companies / US Auto's May 06, 2011 - 01:38 AM GMTBy: Mike_Paulenoff
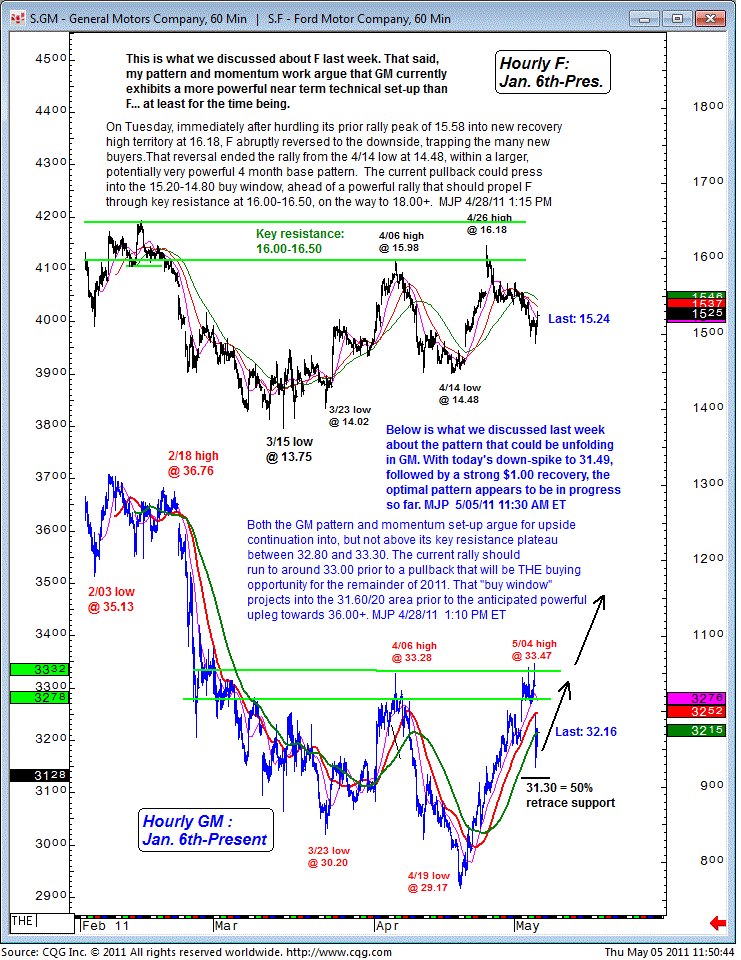
Last week we discussed for subscribers the patterns unfolding in Ford (F) and General Motors (GM). With regard to Ford, we noted that the current outlook could press the stock into the 15.20-14.80 buy window, ahead of a powerful rally that should propel Ford through key resistance at 16.00-16.50 on the way to 18.00.
While Ford proceeded to move as we anticipated, GM exhibits a more powerful near-term technical set-up. We noted last week that the current rally should run to around 33.00 prior to a pullback that will be THE buying opportunity for the remainder of 2011. That "buy window," we said, projects into the 31.60/20 prior to the anticipated powerful upleg towards 36-plus.
With today's spikedown to 31.49, followed by a strong $1.00 recovery, the optimal pattern in GM appears to be in progress so far.

Sign up for a free 15-day trial to Mike's ETF & Stock Trading Diary today.
By Mike Paulenoff
Mike Paulenoff is author of MPTrader.com (www.mptrader.com), a real-time diary of his technical analysis and trading alerts on ETFs covering metals, energy, equity indices, currencies, Treasuries, and specific industries and international regions.
© 2002-2011 MPTrader.com, an AdviceTrade publication. All rights reserved. Any publication, distribution, retransmission or reproduction of information or data contained on this Web site without written consent from MPTrader is prohibited. See our disclaimer.
Mike Paulenoff Archive |
© 2005-2022 http://www.MarketOracle.co.uk - The Market Oracle is a FREE Daily Financial Markets Analysis & Forecasting online publication.


