


The Forgotten Stock Market “Flash Crash” One Year Later
Stock-Markets / Financial Crash May 03, 2011 - 09:36 AM GMTBy: Gary_Dorsch

 One year ago, few traders were expecting a pullback of any significant degree, with the Dow Jones Industrials perched above the 11,000-level. Traders had become complacent after a year long advance, in which the Dow Industrials had risen +70% above its bear market low, while retreating only twice for minor pullbacks. Traders stopped thinking about potential dangers, and started believing the risk of another bear market had vanished. Yet simmering beneath the surface was the specter of a sovereign debt default, rivaling the size of Lehman Brothers’, and threatening the world economy with a “double-dip” recession.
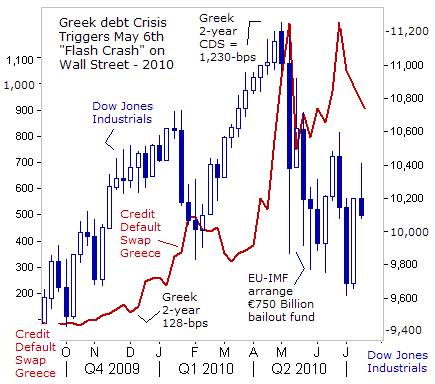
The May 6th, 2010 “Flash Crash,” carries the distinction for the second largest point swing, 1,010-points, and the biggest one-day point decline, of 998.5-points, on an intraday basis in the 114-year history of the Dow Jones Industrial Average. Crashes can occur during bear or bull markets, and are characterized by panic selling and abrupt, dramatic price declines. Whereas the average time for a decline in the S&P-500 to reach the threshold of a bear market is about nine months, a Crash can reach bear market territory in a matter of days.
A Crash is often the result of unanticipated catastrophic events, such as fears of a meltdown of Japan’s nuclear reactors, a sudden banking crisis, or the collapse of a stretched speculative bubble. However, in many cases, the warning signals of danger that precede a stock market Crash are flashing brightly for days, weeks, or months, yet the danger signals are either ignored or incorrectly interpreted by market bulls. “A trend in motion, will stay in motion, until some major outside force, knocks the market off its upward course.”
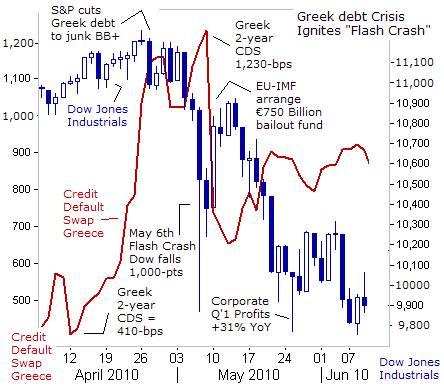
Regulators say a large seller of E-Mini futures and a large purchase of put options on the S&P-500 Index by a hedge fund set off a chain of events that triggered the “Flash Crash.” High frequency traders sold aggressively to liquidate their positions and quickly withdrew from the markets to avoid the meltdown, once the Crash began. The combined actions of these events sent the Dow Jones Industrials plunging -7% in just 15-minutes. Yet for seven days, prior to the historic “Flash Crash,” bullish equity traders had plenty of time to exit from over-extended long positions, but didn’t, because the small and obscure credit default swap market for Greece’s debt, wasn’t even on their radar screens.
The Greek, Irish, and Portuguese bond markets were seriously breaking down for several months preceding the May 6th “Flash Crash” on Wall Street. Prices of government bonds of all three countries continued to fall and interest rates rose sharply, while the cost of insuring their debt from the chance of default rose even more dramatically. The credit default swap (CDS) market is a hotbed of speculation, where banks and hedge funds, can bet on the odds of a country or company defaulting on its debts, without holding the underlying bonds.
In the weeks preceding the May 6th “Flash Crash, the cost of insuring Greece’s debt against the possibility of default, had tripled, from around $410,000 to insure $10-million of debt, to as high as $1.2-million. The threat of a sovereign default, most immediately by Greece, but also by Ireland and Portugal, provided an opportunity for speculators to drive up the price of their CDS rates, while at the same time, profiting by short selling the Euro.
Just a year ago, there was increasing speculation that the 11-year-old Euro currency would break apart under the pressure of a financial crisis, if Greece defaulted on its 330-billion Euros of debt. Analysts were no longer discounting the possibility that a delinquent debtor, such as Greece, could be pushed out of the monetary union. Reflecting the scope of these concerns, investors began shedding positions in Club-Med bonds, and swapped the proceeds into US Treasuries and Japanese yen, both seen as temporary safe havens.
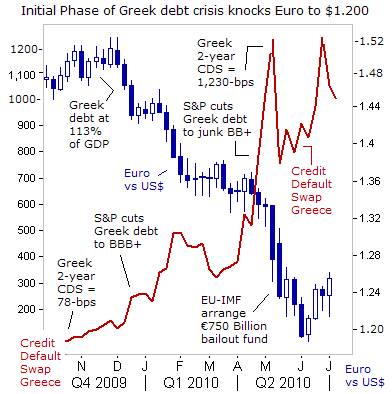
For five months, prior to the “Flash Crash”, the Euro’s exchange rate versus the US-dollar was tumbling from around $1.500 in November 2009, to as low as $1.3200 by late April 2010. At the same time, the cost of insuring $10-million of Greek government bonds, against the chance of a default or restructuring was steadily climbing upwards. The newly installed Greek government dropped a bombshell, when it admitted that the country’s public debt was far greater than previously reported, at 112.5% of GDP, and was projected to hit 135% by 2011. The S&P debt rating agency moved quickly to lower Greece’s rating from A- to BBB+, and warned of further reductions, if Athens, “is unable to gain sufficient political support to implement a credible medium-term fiscal consolidation program.”
In the currency markets, the Euro began to slide, as yields on Greek, Irish, Portuguese, and Spanish bonds began to climb sharply higher. Attracted to the highly indebted Greek bond market like vultures to a decaying corpse, the CDS traders at major banks and hedge funds moved in for the kill. “Too big to fail” banks were able to return to the gambling tables fully aware that their losses would be covered in future by taxpayers, despite their involvement in the most hazardous forms of speculation. But there were also legitimate hedging activities in the CDS market, since French banks held $75-billion worth of Greek debt, Swiss banks with $64-billion, and German banks with $43.2 billion.
The US-stock market’s rally from the March 2009 lows was perhaps, the most non-believed rally in history. But the bears got a sense of vindication by the “Flash Crash,” which at the time, was interpreted in many circles as a watershed event, signaling the end of the cyclical bull market that began 14-months earlier. This time, the culprit was a spike in Greece’s bond yields, and its soaring credit default swap rates, and heightened worries that Athens might default on more than $300-billion of debt. The overall amount of insurance on Greece’s debt hit $85-billion in February 2010. One year earlier, the same figure stood at $38-billion.
On April 27th, 2010, the S&P rating agency pushed Greece to the brink of the financial abyss and downgraded Portugal’s debt to A-, fueling fears of a continent-wide debt meltdown in Europe. Stocks around the world tanked when Greek bonds were lowered to junk status, at BB+. Greece’s financial contagion began spreading to Portugal and Ireland. European stock exchanges fell 2.5%, and the Dow Jones Industrial fell more than 200-points. Greek and Portuguese stock indexes were especially hard hit, falling -6.7% and -5.4%, respectively. The Euro continued to spiral lower, briefly skidding below $1.200 in June 2010, until China’s political leaders signaled their support for the common bloc currency.
Two-weeks before the “Flash Crash” unfolded, Germany’s finance minister Wolfgang Schauble warned that a failure to rescue Athens would risk a financial meltdown. “We cannot allow the bankruptcy of a Euro member state like Greece to turn into a second Lehman Brothers,” he told Der Spiegel. “Greece’s debts are all in Euros, but it isn’t clear who holds how much of those debts. The consequences of a national bankruptcy would be incalculable. Greece is just as systemically important as a major bank,” he warned. However, traders on Wall Street weren’t fazed by Schauble’s warnings, reckoning that at the end of the day, the wealthy Euro-zone nations would be opt for a bailout, of their delinquent neighbors.
Yet the fallout from the “Flash Crash” would lead to a -14% correction for the Dow Industrials, the only meaningful setback during its cyclical Bull rally. It seemed as if, the old adage, “Sell in May, and go Away” was still a valid tidbit of advice. When the Dow Industrials slumped to below the psychological 10,000-level, there were renewed fears over what bad debts lurked on the balance sheets of Europe’s banks, that could paralyze lending and trigger a “double-dip” recession in the Euro-zone. Stock market bulls lost their swagger, even after EU finance ministers agreed to fund a €750-billion ($1-trillion) bailout fund for delinquents, and to prevent the Euro currency from tearing apart and derailing the global economic recovery.
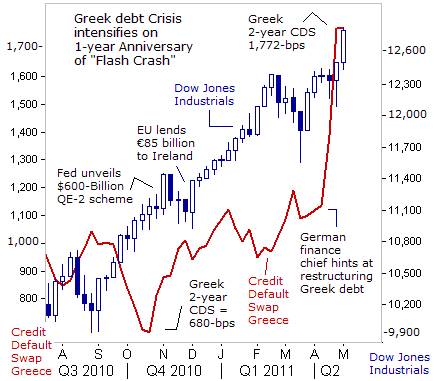
Yet stock market corrections trigger by previous debt crises in Argentina, Brazil, Mexico, and Russia, proved to be short-lived, were eventually recouped within a short period of time. In the case of Greece, the EU’s “Shock and Awe” bailout fund quelled the rebellion of the bond vigilantes for five months. By October 2010, the 2-year Greek CDS rate had fallen to as low as $680,000. Meanwhile, the Fed was telegraphing its intention to unleash a second tidal wave of liquidity - “Quantitative Easing” (QE-2), aimed at inflating the value of the US-stock market, in a determined effort to boost household wealth and confidence, and persuade companies to resume hiring workers and increasing capital spending.
Yet the Greek debt crisis was never extinguished. While emergency loans enabled Athens to stave off bankruptcy for a couple of years, Greece’s debt has continued to grow to 340-billion Euros. Greece is suffering from a 15.1% jobless rate and its economy is still in recession, contracting at a -4% annual rate. Its citizens can’t live under the yoke of EU imposed austerity and financial slavery, simply to pay off debts to Europe’s banking Oligarchs.
On the One-year Anniversary of the historic May 6th “Flash Crash,” the Dow Jones Industrials finds itself soaring to the 12,800-level, and far above the July 2010 low near the 9,600-area. Yet today, the odds that Greece could default on its debts, or demand a restructuring, are far higher than before the “Flash Crash”. Last week, the 2-year CDS rate for Greek government bonds soared to as high as $1.8-million, rising dramatically since April 14th, when Germany’s finance chief Wolfgang Schaeuble, acknowledged officially for the first time that Athens may need to restructure its debt. The yield on Greece’s 2-year note spiked to 25.35% last week, the highest since it received a 110-billion Euro bailout last year.
“For me restructuring is the only road to take, for Greece to feel some relief and for creditors to contribute to the solution of the Greek problem,” said Lars Feld, one of the “five wise men” who advises the German government on economic policy, on May 1st. Clemens Fuest, who chairs the German finance ministry’s technical advisory committee, said Greece must restructure its debt no later than April 2013. “I don’t think Greece can repay its debt. If there is no restructuring, uncertainty over the future of Greece's economy will delay its growth.” Fuest said European Union leaders had started to prepare for such an eventuality. “They do not discuss a Greek debt restructuring openly because this would cause bigger uncertainty and speculation in the markets,” he was quoted as saying.
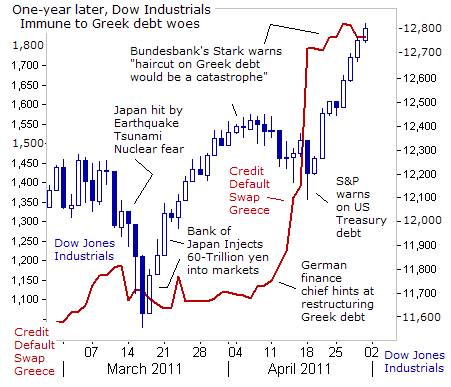
“The fear is that markets will say that if Greece restructures today, tomorrow it will be Ireland, Portugal, and Spain, and so on must be seriously taken into account. The question is to contain the Greek restructuring to Greece only,” Feld added. But Greece’s finance deputy Philippos Sachinidis warned that a debt restructuring involving a 50% haircut, as is necessary, would send pension funds and banks into an abyss. Bundesbank deputy Juergen Stark raised the specter of a Lehman Brother’s style collapse to underline his opposition to restructuring Greece’s mountain of debt. “A restructuring would be short sighted and bring considerable drawbacks. In the worst case, the restructuring of a member state could overshadow the effects of the Lehman bankruptcy,” Stark warned.
Despite these dire warnings about Greece’s debts, - (and the inevitability of a restructuring), bullish traders on Wall Street are unfazed by the upward spike in Greek CDS rates and bond yields to all-time highs, - just like a year ago, before the “Flash Crash.” Everyone has seen this movie before, and in the final scene, the Euro-zone government or the Bernanke Fed rides to the rescue, with emergency bridge loans, or torrents of liquidity injects, to prop-up the stock markets. Most traders a re betting that a restructuring of Greece debts won’t include a haircut on the principal, by instead, would be limited to an extension of the maturity of its debt, combined with a lowering of the interest rate. By delaying a haircut, Europe’s banks won’t have to recognize an immediate loss for these “non-performing” loans.
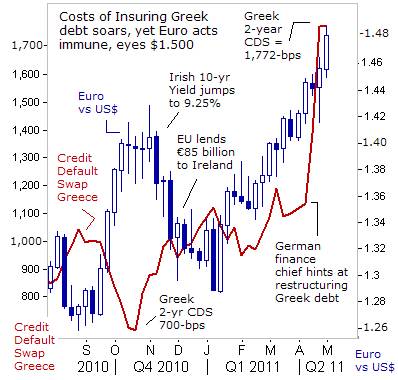
One-year ago, the upward spiral in Greece’s 2-year CDS rate to 1,200-bps knocked the Euro currency to as low as $1.1900. Yet today, the Euro is priced 30-US-cents higher at $1.4850, even though the odds of a restructuring of Greece’s debt has risen to new heights, reaching 1,810-bps last week. Likewise, the spike in Greece’s 2-year yield to 25.35% hasn’t stopped the Euro from climbing sharply higher. The reality is, as history indicates, is that the market obeys no fundamental rules other than herd instincts and mass psychology.
Since February, currency traders have been fixated on the ECB’s pledge to lift its repo rate, albeit in baby steps, to 2% by year’s end, from 1.25% today. The ECB is utilizing a stronger Euro to fend off inflationary pressures from sharply higher import prices of raw materials, and it doesn’t require a sharply higher ECB repo rate to crush the US-dollar these days. The US-dollar is under assault by central banks around the world that are alarmed by the Fed’s massive monetization of the US-Treasury’s debt. There’s also the prospect of zero-percent interest rates in the US for as far as the eye can see, just like in Tokyo, where the Bank of Japan has recently injected a fresh batch of 60-trillion yen into the local money markets, in a government directed campaign to inflate the Nikkei-225 index.
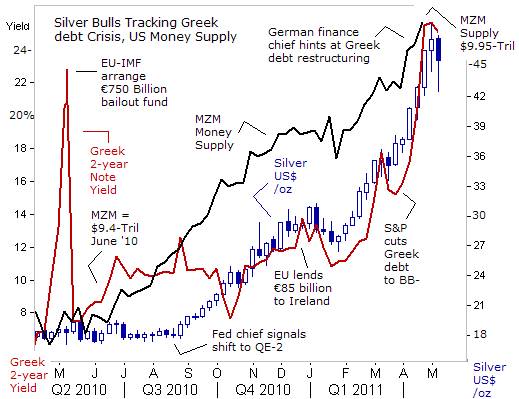
One of the most notable shifts in the global marketplace since the May 6th, “Flash Crash” has been the dramatic increase in the price of Silver, up +145% from a year ago, to around $44 /ounce today. Coined as the “poor man’s Gold” the Silver market has shocked the investment world, with its stunning advance towards $50 /ounce last week. After a parabolic increase, it’s natural for the Silver market to pause, and attract short sellers near $50 /oz, reckoning that a correction is looming on the horizon, simply due to the urge for die-hard Silver bulls to turn huge paper profits into cash and to take a few chips off the table.
The record trading volume in Silver futures contracts, and the enormous surge in share volume of the Silver iShares Trust (ticker SLV.N), is indicative of distribution, and a greater willingness of shareholders of SLV.N to sell their shares at current prices. On May 1st, Silver had its own version of a “Flash Crash” when it opened $5 /oz lower in the Far East, - briefly falling to $42.58/ oz. The Chicago Mercantile Exchange provided the catalyst, by hiking its Silver margins for the second time in a week. For speculators, the initial margin is increased to $14,513 per each 5,000-oz contract, up from $12,825 previously. The maintenance margin has been jacked-up to $12,000 from $9,500 last week.
Is Silver’s rally towards $50 /oz a speculative bubble that’s bound to burst, or rather, are Silver’s big gains over the past eight months, sustainable over the longer-term? Unlike stocks, precious metals don’t have P/E ratios, or an income stream to gauge valuations. However, over the past decade, one of the most reliable metrics used to value precious metals is tracking the amount of money that’s printed by central banks, and the level of overnight interest rates. In today’s marketplace, the money supply in the emerging nations is growing at double digit rates, while the central banks in the developed world are pegging their interest rates near zero-percent. In other words, it’s been a perfect storm for the precious metals.
The message that behind’s Silver’s explosive rally towards $50 /oz, is that the investing public around the globe, from China to India, to Europe, and the US, is rapidly losing confidence in the purchasing power of paper money. Increasingly, Silver is being hoarded by the general public, as a viable hedge against the explosive growth of the world’s money supply. Silver is now revered as a proxy for Gold at an affordable price. In the US, there is belated recognition among the populace, that the Fed and the White House are aiming to monetize the Treasury’s debt, and that foreign central banks, stuffed with too many US-dollars, are switching their reserves into better alternatives, such as precious metals.
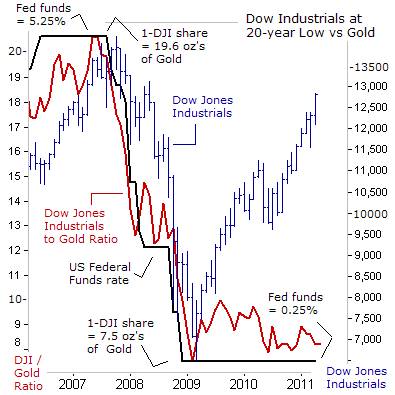
Since the Dow Jones Industrials bottomed out at the 6,500-level about 26-months ago, it’s nearly doubled to 12,800 today. Yet when seen through the prism of Gold, 1-share of the Dow Industrials is equal to 8.2-ounces of Gold today, an exchange rate that’s virtually unchanged from two years ago. In fact, the Dow-to-Gold Ratio is hovering at levels that prevailed in 1992. It’s true that US-corporate profits are surging to all-time highs, providing a fundamental justification for the stock market’s V-shaped recovery. Still, the Dow Industrials’ V-shaped recovery, now pointing towards it all-time high is the most disrespected rally in history, even though the Dow Transports have already hit record high territory this week.
The greatest mistake is underestimating the power of the Fed’s printing press. It’s become increasingly clear that the Fed is in the business of rigging the stock market, at the request of the Obama White House, through its QE operations. Assuming the Fed is aiming to inflate the Dow Industrials towards its all-time highs near 14,200, and if the Dow-to-Gold ratio stays little changed at today’s 8.2, - as expected, it would imply that spot Gold can still climb higher towards $1,730 /oz in the months ahead.
There is a widely held belief on Wall Street, that the Bernanke Fed will always ride the rescue of the stock market, using all tools at its disposal, including a potent dose of QE-3 if necessary, in order to prevent a meaningful downturn in the US-stock market. While the implicit guarantee of the “Bernanke Put” is really designed to encourage risky bets in the stock market, investors in Gold have also enjoyed the benefits of the “Bernanke Put,” since its trademark is massive money printing and a steady devaluation of the US-dollar.
Yet there are always dangers lurking beneath the surface that can suddenly shock the markets, and are seized upon by hedge funds and bank traders to engineer frightening shakeouts, such as the May 6th “Flash Crash”. Already, the speculative activities of the Wall Street Oligarchs are inflating new market bubbles, at the behest of the Fed, and laying the groundwork for future financial crises that threaten to explode at anytime. With that in mind, it wouldn’t be surprising to see the Dow-to-Gold Ratio continue to sink in the year ahead.
This article is just the Tip of the Iceberg of what’s available in the Global Money Trends newsletter. Subscribe to the Global Money Trends newsletter, for insightful analysis and predictions of (1) top stock markets around the world, (2) Commodities such as crude oil, copper, gold, silver, and grains, (3) Foreign currencies (4) Libor interest rates and global bond markets (5) Central banker "Jawboning" and Intervention techniques that move markets.
By Gary Dorsch,
Editor, Global Money Trends newsletter
http://www.sirchartsalot.com
GMT filters important news and information into (1) bullet-point, easy to understand analysis, (2) featuring "Inter-Market Technical Analysis" that visually displays the dynamic inter-relationships between foreign currencies, commodities, interest rates and the stock markets from a dozen key countries around the world. Also included are (3) charts of key economic statistics of foreign countries that move markets.
Subscribers can also listen to bi-weekly Audio Broadcasts, with the latest news on global markets, and view our updated model portfolio 2008. To order a subscription to Global Money Trends, click on the hyperlink below, http://www.sirchartsalot.com/newsletters.php or call toll free to order, Sunday thru Thursday, 8 am to 9 pm EST, and on Friday 8 am to 5 pm, at 866-553-1007. Outside the call 561-367-1007.
Mr Dorsch worked on the trading floor of the Chicago Mercantile Exchange for nine years as the chief Financial Futures Analyst for three clearing firms, Oppenheimer Rouse Futures Inc, GH Miller and Company, and a commodity fund at the LNS Financial Group.
As a transactional broker for Charles Schwab's Global Investment Services department, Mr Dorsch handled thousands of customer trades in 45 stock exchanges around the world, including Australia, Canada, Japan, Hong Kong, the Euro zone, London, Toronto, South Africa, Mexico, and New Zealand, and Canadian oil trusts, ADR's and Exchange Traded Funds.
He wrote a weekly newsletter from 2000 thru September 2005 called, "Foreign Currency Trends" for Charles Schwab's Global Investment department, featuring inter-market technical analysis, to understand the dynamic inter-relationships between the foreign exchange, global bond and stock markets, and key industrial commodities.
Copyright © 2005-2011 SirChartsAlot, Inc. All rights reserved.
Disclaimer: SirChartsAlot.com's analysis and insights are based upon data gathered by it from various sources believed to be reliable, complete and accurate. However, no guarantee is made by SirChartsAlot.com as to the reliability, completeness and accuracy of the data so analyzed. SirChartsAlot.com is in the business of gathering information, analyzing it and disseminating the analysis for informational and educational purposes only. SirChartsAlot.com attempts to analyze trends, not make recommendations. All statements and expressions are the opinion of SirChartsAlot.com and are not meant to be investment advice or solicitation or recommendation to establish market positions. Our opinions are subject to change without notice. SirChartsAlot.com strongly advises readers to conduct thorough research relevant to decisions and verify facts from various independent sources.
Gary Dorsch Archive |
© 2005-2022 http://www.MarketOracle.co.uk - The Market Oracle is a FREE Daily Financial Markets Analysis & Forecasting online publication.