


Understanding Where We Are in the Silver Bull Market
Commodities / Gold and Silver 2011 May 03, 2011 - 01:24 AM GMTBy: David_Banister

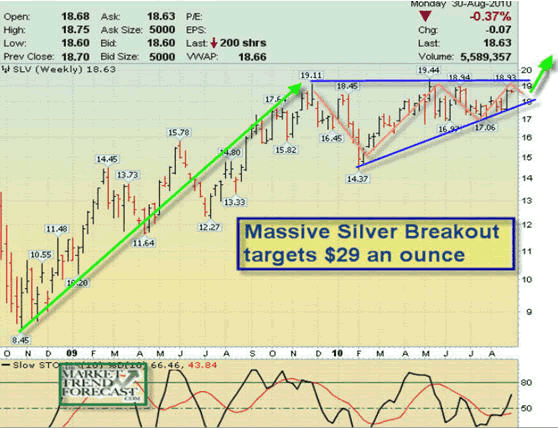
 Last August I told my subscribers to prepare for a monster rally in Silver, which at the time of my forecast was $18.73 per ounce. I drew up a chart and predicted a huge rally to $29 an ounce, and we ended up at $31 or so just a few months later. This was entirely a crowd behavioral move that I foresaw in advance, based on patterns that R.N. Elliott developed in the 1920's and 1930's. My theory was besides the crowd pattern (a 20 month odd Triangle consolidation), that investor's would begin to view Silver as "Poor man's Gold" and buy it. Literally, the idea is as simple as investors will simply think that "Gold is too expensive, but silver is cheap". That is the explosion power that is behind this move from $19 to $50 an ounce since late August 2010.
Below is the original chart I sent to my subscribers outlining this triangle pattern and the likely move:
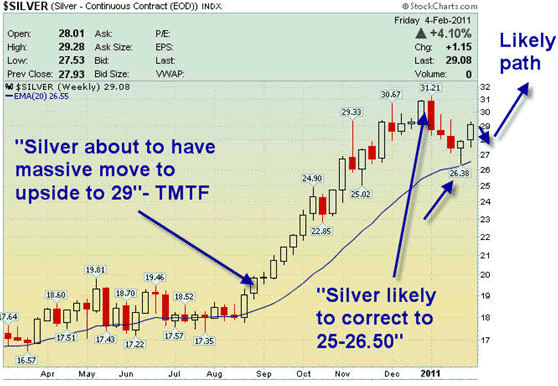
After Silver ran hard and fast, it left a lot of talking heads on CNBC and everywhere else scratching their heads and wondering what just happened. If you learn and understand the basics of Elliott Wave Theory, you can begin to foresee what is about to happen and stop scratching your head all the time. Watching the analysts on CNBC is like watching the Monday morning quarterbacks following an NFL Sunday. After that massive silver run from $18 to $31, it was time for a correction and I called for $25 to $26.50 as likely in a normal pessimistic crowd wave 2 pattern down. Once that completed, I sent my subscribers the chart below outlining another Bull wave to $39-$45 per ounce:
Silver then eventually ran to $45 per ounce in April of 2011 and had a brief spike to near $50 to test the all time highs just in the past week or so. The action has been wild since then, because after a wave pattern from $18 to $31, then back to $26, then up to $47... the crowd will begin to turn mildly pessimistic in a current "wave 4 " correction pattern. This is when you will begin to hear excuses for Silver dropping, including believe it or not blamed on the death of Osama Bin Laden. In truth, whatever happens near term to explain the current correction in Silver is simply Monday morning quarterbacking. Using the current days headlines to explain the action that I already know is coming. Other excuses are the change in margin requirements on silver contracts and the squaring of positions at end of month etc.
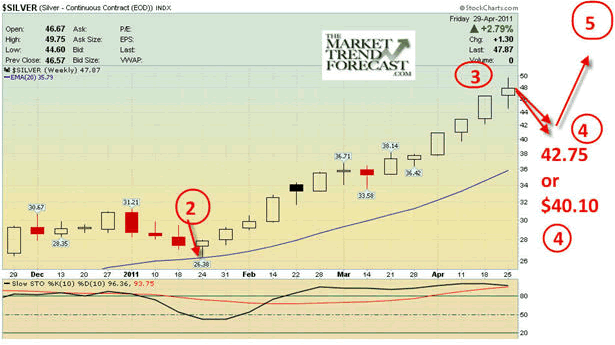
I expect Silver to correct to the 40 to $42.75 areas based on my Fibonacci work and Elliott Wave views, and after this 4th wave consolidation we will see a surge to as high as $60 per ounce. Any pullbacks in Silver should be bought here and same with the Silver stocks post haste. Below is my latest chart forecast on Silver:
If you would like to stop scratching your head, get more comfortable where the markets are heading in both Gold , Silver, SP 500 etc in advance, then take a look at www.MarketTrendForecast.com, and take advantage of a 24 hour coupon special to subscribe, or just sign up for the occasional but not always timely free updates. Our subscribers learn and earn!
Dave Banister
CIO-Founder
Active Trading Partners, LLC
www.ActiveTradingPartners.com
TheMarketTrendForecast.com
Dave Banister is the Chief Investment Strategist and commentator for ActiveTradingPartners.com. David has written numerous market forecast articles on various sites (MarketOracle.co.uk, 321Gold.com, Gold-Eagle.com, TheStreet.Com etc. ) that have proven to be extremely accurate at major junctures.
© 2011 Copyright Dave Banister- All Rights Reserved
Disclaimer: The above is a matter of opinion provided for general information purposes only and is not intended as investment advice. Information and analysis above are derived from sources and utilising methods believed to be reliable, but we cannot accept responsibility for any losses you may incur as a result of this analysis. Individuals should consult with their personal financial advisors.
© 2005-2022 http://www.MarketOracle.co.uk - The Market Oracle is a FREE Daily Financial Markets Analysis & Forecasting online publication.