Dow Jones Transportation Stock Index Rolls to Record High
Stock-Markets / Stock Markets 2011 May 02, 2011 - 06:08 AM GMTBy: Money_Morning
 Jon D. Markman writes:
The biggest news of the week for me was the fantastic earnings report from railroad Norfolk Southern Corp. (NYSE: NSC), which pushed the Dow Jones Transportation Average to a new record high.
Think about that. New. All-Time. High. For the transports. The transports! When crude oil prices are pressing $112 a barrel. When the economy is limping along at an annualized growth rate of less than 2%. When the bears said we should be diving for cover.
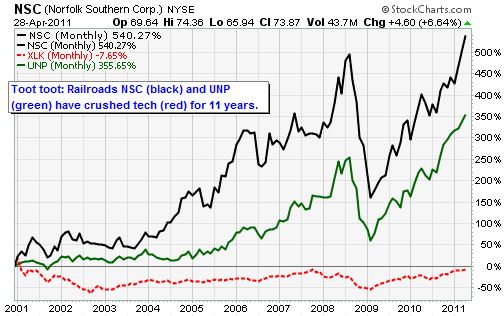
The railroads have been killing it, and not just the likes of NSC, Union Pacific Corporation (NYSE: UNP) and CSX Corporation (NYSE: CSX). It's also the freight expeditors and truckers like C.H. Robinson Worldwide Inc. (Nasdaq: CHRW), Expeditors International of Washington (Nasdaq: EXPD), and Ryder System Inc.(NYSE: R).
A lot of these stocks are in my recommended SPDR Industrials ETF (NYSE: XLI) fund, so owners can do a fist-pump over this achievement. New highs for stocks and indexes mark moments when the average shareholder has emerged a winner. New highs remove sellers' overhang, allowing stocks to move up more freely.
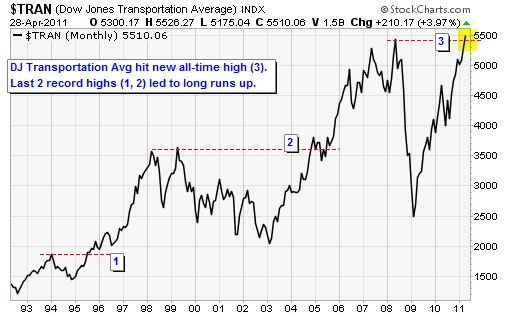
This is why nothing is more bullish than a new high (except the last one). Once you get the first one, a lot more tend to follow. And once you have a major index like the DJTA make a new high, then others -- Dow Jones Industrial Average, we're talking about you - tend to follow. So don't fear new highs, figuring they mark an end. They are more often new beginnings.
It's possible this was a false breakout for the Dow Transports -- one happened in May 2008, just before the bear market got under way -- but probably not at current price/earnings multiples, not when credit is plentiful, not when the Fed is pushing ZIRP (zero interest rate policy), not when sentiment is still dour.
GDP Shocker
Maybe the strangest thing about the transports hitting a new high is that it happened just as the economy threw a brick at the backboard.
The latest U.S. Commerce Department report shows domestic U.S. growth clocked in at a mere 1.8% annualized in the first quarter -- way down from the 3.5% that had been expected earlier in the month. It was attributed to the surge in energy prices as well as bad weather, both of which economists judge to be transitory.
You knew this was coming. We have talked about it a lot. But it's still a bit of a shocker.
Among the key components dragging GDP down: Consumption growth slowed to 2.7% from 4% the prior quarter; business investment rose by just 1.8% as a 11.6% gain in equipment investment was offset by a 2.1% drop in structure investment; and residential investment fell by 4.1%.
Also notable was an 11.7% decline in national defense spending, which economists believe will reverse in the current quarter. And finally, also on the negative side, was a 3.3% decline in state and local government spending, which reflects municipal finances.
While a 1.8% annualized growth rate is pretty weak at any time, and may well have legitimate causes such as the bad winter weather, that it occurred at a time of tremendous monetary and fiscal stimulus has to knit some brows among policy makers.
The economy should be getting a lot more bang for its buck. Such anemic growth gives the Federal Reserve more cause to maintain its stimulative policies. It's one of those "bad news is good news" deals, at least from the Fed's point of view.
Stocks, bonds and commodities swung higher again over the past week on surprisingly low volume, as more than 100 major companies reported stronger-than-expected earnings. The market is celebrating the Fed's decision to keep current monetary policy in place and shrugging off signs of weakness, like the slowdown in GDP growth and rising unemployment claims.
Fed chief Benjamin S. Bernanke might as well have ended his press conference on Wednesday with the exclamation, "Party on!" because that's what the markets heard between the lines of his otherwise sonorous comments. He essentially said it's still happy hour at the Easy Money Inn, and the drinks are on the house.
Markets Keep Chugging
TheDow Jones Industrials rose a mighty 2.6%, the Standard & Poor's 500 Index rose 1.9%, the Nasdaq Composite rose 1.8% and the Nasdaq 100, weighed down by Microsoft Corporation (Nasdaq: MSFT) and Research in Motion (Nasdaq: RIMM), rose only 1.1%.
Breadth was positive, with advancers leading decliners by a 3-2 margin, and volume was average. New highs rose to 998 by the end of the week, while new lows flat-lined at 95. The leaders are back to serving as the locomotives of this train; sellers are getting out of the way.
If this move to the upside despite bad economic news makes no sense to you, then use the U.S. dollar as your decoder ring. It's dropping like a rock without a parachute, and no one in the U.S. government is doing a thing to stop it unless you consider lip service some sort of safety net.
It's been the same old story since the start of the first round of quantitative easing: ZIRP = lower dollar = higher stocks and commodities.
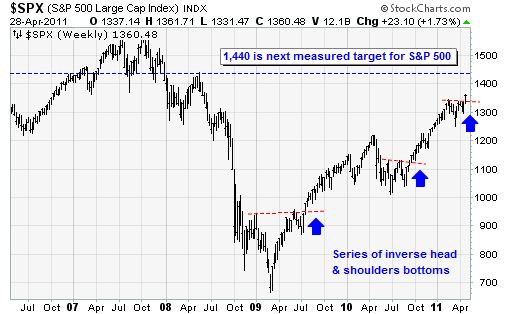
The S&P 500 has now cleared the inverse head-and-shoulders pattern discussed last week; as long as it remains above 1,345 its next measured target is 1,440. The next target for gold futures is $1,620 an ounce; the next target for crude oil is $128 a barrel.
Without a doubt there will be a lot of volatility along the way. But odds are high these targets will be met by year-end unless the Fed drops a bombshell and decides to raise interest rates in the fall.
Something else that jumped out at me this week was the moon shot in silver prices to a 30-year high just above $50, though they did settle back to $47.90. Some see a bubble in silver, but you could just as easily say it merely reflects the popping of a bubble in the dollar.
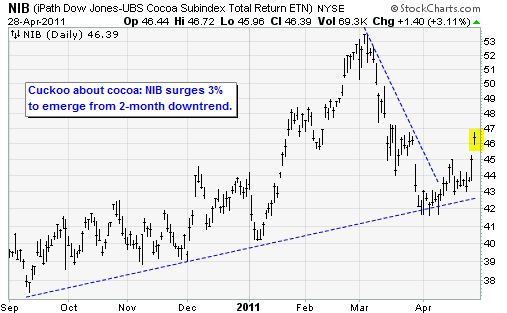
The U.S. dollar index fell 1.4% in the past week to a new two-year low, so the rise in commodity prices mostly just reflects the reality that it takes more dollars to buy a given amount of raw materials. One more example besides gold and silver: Cocoa, which can be bought in the exchange-traded fund iPath Dow Jones-UBS Cocoa Subindex Total Return ETN (NYSE: NIB) as shown above.
Bottom line:The markets are overbought, and so are overdue for a slight setback or flat spot. It may be just enough to get the "sell in May" crowd going, but the spring surprise this year might well be a flash higher in May and June rather than another 2010-style wipeout.
Credit Canard
Oddly, the main thing investors seem to be worried about is what will happen to the government debt market after the Fed stops its $600 billion bond-buying campaign (QE2) in June.
And yet the credit market is trading as if it doesn't have a care in the world!
This is because most credit investors realize there is actually a dearth of debt to buy -- strange but true -- and that the bonds the Fed has been buying will be snapped up.
Remember last year around this time when the Fed announced it would stop buying mortgage debt? Everyone freaked out, fearing mortgage rates would soar as mortgage bond prices crashed.
That has hardly been the case, as we know from the results of our DoubleLine Total Return Bond I (MUTF: DBLTX) fund, and theAmerican Capital Agency Corp. (Nasdaq: AGNC) position, both of which buy virtually nothing but mortgage debt yet have been fantastic performers.
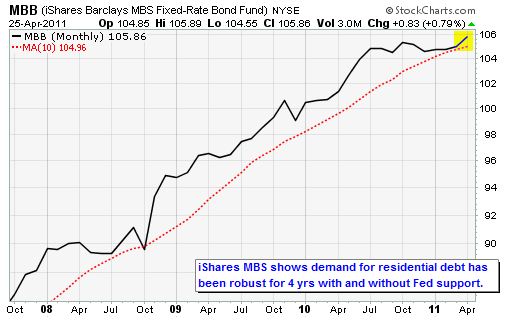
Above is the iShares Lehman MBS Bond Fund (ETF) (NYSE: MBB), which bears swore would collapse in the middle of last year when the Fed stopped buying mortgages.
But it didn't happen because private and overseas investors stepped in to buy these credits, mostly on margin to amplify returns, and have been so amply rewarded for it they have continued buying.
And as long as we're on the subject, let me add that AGNC reported earnings last week of $1.30 per share, which was in line with consensus expectations. It's a leveraged mortgage REIT (real estate investment trust) yielding 19.2% per year.
The Week Ahead
May 2: Construction spending (3/11); ISM Index (4/11); Auto Sales; Truck Sales
May 3: Factory orders (3/11)
May 4: MBA Mortgage Index for week ending 4/29; Challenger Job Cuts; ADP Employment Change; ISM Services; Crude Inventories
May 5: Initial jobless claims; Continuing Claims; Productivity; Unit Labor Costs
May 6: Nonfarm payrolls (4/11); Unemployment Rate (4/11); Hourly Earnings; Average Workweek; Consumer Credit (3/11)
Source : http://moneymorning.com/2011/05/02/dow-jones-transportation-average-rolls-to-record-high/
Money Morning/The Money Map Report
©2011 Monument Street Publishing. All Rights Reserved. Protected by copyright laws of the United States and international treaties. Any reproduction, copying, or redistribution (electronic or otherwise, including on the world wide web), of content from this website, in whole or in part, is strictly prohibited without the express written permission of Monument Street Publishing. 105 West Monument Street, Baltimore MD 21201, Email: customerservice@moneymorning.com
Disclaimer: Nothing published by Money Morning should be considered personalized investment advice. Although our employees may answer your general customer service questions, they are not licensed under securities laws to address your particular investment situation. No communication by our employees to you should be deemed as personalized investent advice. We expressly forbid our writers from having a financial interest in any security recommended to our readers. All of our employees and agents must wait 24 hours after on-line publication, or 72 hours after the mailing of printed-only publication prior to following an initial recommendation. Any investments recommended by Money Morning should be made only after consulting with your investment advisor and only after reviewing the prospectus or financial statements of the company.
Money Morning Archive |
© 2005-2022 http://www.MarketOracle.co.uk - The Market Oracle is a FREE Daily Financial Markets Analysis & Forecasting online publication.


