Stock Market New High is Possible
Stock-Markets / Stock Markets 2011 Apr 22, 2011 - 02:47 AM GMTBy: Bob_Clark
 As the stock market starts to buck, investors wonder what is going to happen next. My analysis suggests that there may be one more new high left before we see a bigger correction.
Tuesday evening we got the latest earnings numbers from Intel and IBM and they were well received. Now the question is. Will good earnings be enough to get prices moving back up?
If you have followed me and have read my past articles, you will know that by using cyclical modeling and Fractal analysis, it is possible to predict what the market will do with remarkable accuracy.
It also allows us to enter the markets at less risky points in time, when the odds of success are much higher. That is very important if you are using leverage to hedge against inflation and the hidden tax that you pay on your illusory capital gains. More leverage equals more risk. That is when precision becomes important.
The truth is, that being able to forecast the larger market swings is key to increased portfolio performance. For example I was able to improve my clients bottom line by selling their holdings in GLD at $138 and re entering at $128 as you can see from this article. What is wrong with gold. That was almost an 8 % bottom line improvement. In an account margined 50 % (increased leverage) it added 12 %.
The mood is bullish
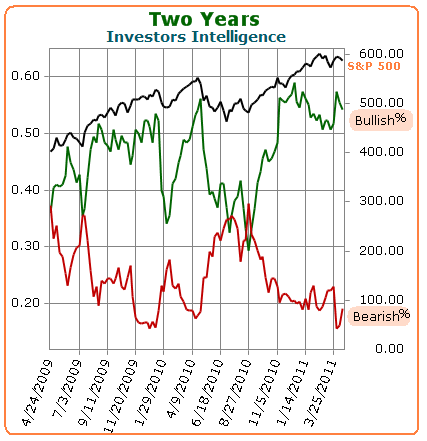
First lets take a quick look at what the public and many funds are thinking and doing, by studying the latest Investors Intelligence data in chart form.
We see there is no fear. There are buyers on every dip.
When we subtract the percentage of bears from the percentage of bulls, we are at record levels of extreme bullishness, going back many years. Notice what happened last year at this time when we were at high levels of bullishness.

It's a model market
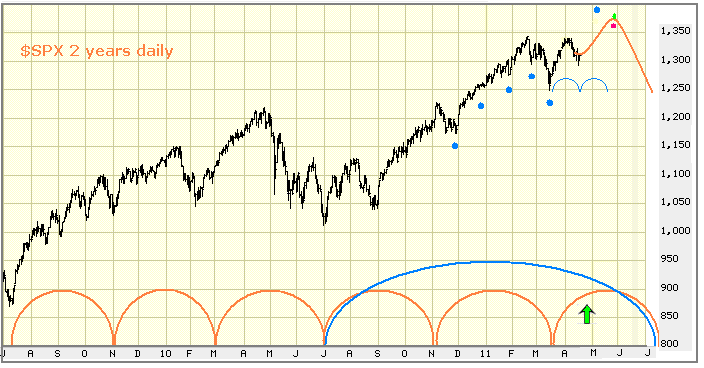
Today I have used cyclical modeling and fractal analysis to look at the general market. Below I have extrapolated time and price based projections onto the chart. It shows how I expect the stock market to act over the next month or more.
The orange arcs represent the 4 month cycle that I use to trade with. It has remained consistent over the years, although it does get fuzzy from time to time. It will shift to the right or left, but usually it is accurate within a fairly tight variable. I have also put in the 1 year cycle which is also usually reliable.
Here is how I see the current cyclical environment.
Lets start with the big cycles. The ones that are even bigger than the 1 year cycle. They are going up. We know this because the one year cycle is making higher highs and higher lows. It is also topping late in it's cycle. In cyclical analysis, late tops are known as late translation. It is a sign that the larger dominant cycles are still pushing hard up.
We see that the 1 year cycle is starting to go down to make it's next low and is probably not going to give much upside lift for the next couple of months. In fact it should be exerting a downward bias.
So why do I think we will go higher?
It appears the 4 month cycle is now in the ascendancy again and should give lift for another month (green arrow). There is also a 1 month cycle, which I have marked in blue. It has been coming in at the end of each month. We see a clear mid month low last month. We can expect that slight change in timing will cause some confusion as we get closer to the end of this month. It, combined with the lift from the 4 month cycle, should give enough upward momentum to make one last high next month.

Then I add Fractals
Once I have my cyclical model in place, I use fractal analysis to confirm the probability of one last new high and to pinpoint targets of price and time. I generated 3 different fractal data points, which I have marked in with different colored dots. The dots represent the time and price where the move should change direction.
Interestingly, none of the variables I plugged in, said we will not go to a new high. Two were almost identical.
Bottom line
I call this a "getting blood from a stone" trade.
We are clearly late in the 1 year cycle and a look at the investor sentiment gauges shows extreme bullishness. Therefore I subscribe to the "if there are that many people, dumb enough to be buying this high, then the Fat Boys will be happy to jig the price higher and sell to them" theory.
We should continue to work higher into next month. Possibly grinding higher most of the month. If we bolt higher early in the month and get close to the 1400 level, we will probably top early at that point (blue dot).
If we do not see steam to the upside within the next 2 weeks, then it means we get a correction into the summer that is bigger than most are expecting.
Why don't you learn to do it yourself?
If you are struggling or sitting in cash, I will help you move forward.
First read my archived articles. If you like my track record, then take my course or order my videos.
I have a structured approach to investing that has worked consistently for 20 years. It lets you turn volatility and inflation into wealth.
I teach you how to take tiny risks, to capture big gains.
I have packed a 5 video set with a trading and investing method that works. How well does it work? I teach my course trading with my own money. I have never had a failed student.
Low maintenance, long term trend following
I have a very simple trend following technique that has not given a false signal in the 15 years I have been used it. I am not a big fan of moving averages because of the whip saw losses they generate, but this one is something else. It is available on my website, with instructions on how to use it for a small donation.
The Fat Boy can make you rich. Trade with them or be their victim.
Bob Clark is a professional trader with over twenty years experience, he also provides real time online trading instruction, publishes a daily email trading advisory and maintains a web blog at www.winningtradingtactics.blogspot.com his email is linesbot@gmail.com.
© 2011 Copyright Bob Clark - All Rights Reserved
Disclaimer: The above is a matter of opinion provided for general information purposes only and is not intended as investment advice. Information and analysis above are derived from sources and utilising methods believed to be reliable, but we cannot accept responsibility for any losses you may incur as a result of this analysis. Individuals should consult with their personal financial advisors.
© 2005-2022 http://www.MarketOracle.co.uk - The Market Oracle is a FREE Daily Financial Markets Analysis & Forecasting online publication.


