


Inflation Expectations Are Expected To Soar During 2008
Economics / Inflation Nov 14, 2007 - 10:43 AM GMTBy: Jordan_Roy_Byrne

 It has been over month since my last editorial, “2008-2009: Rising Inflation Expectations Amidst an Inflationary Storm.” Since then commodities have continued to soar while the stock market has struggled in the wake of the ongoing credit crisis. It now appears that a decoupling between commodities and stocks is starting to take place. Such a decoupling is a catalyst for rising inflation expectations.
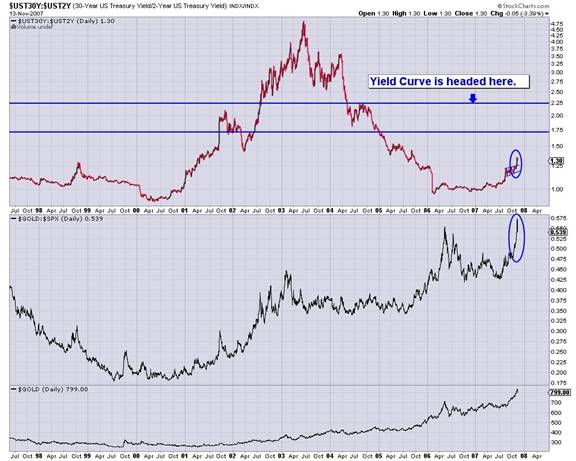
This is apparent in a few charts. The picture below contains three charts. On top we have one yield curve ratio (the 2 and 30 year Treasury Notes). In the middle frame we have gold divided by the S&P 500 and lastly we have gold. Gold tends to follow the first two charts, which are measurements of inflation expectations. In just the past month (circled) we have seen both the yield curve and the gold/S&P ratio soar. If the market sensed inflation was coming, money would favor into hard assets (gold) at the expense of financial assets (S&P 500). The bond market's reaction is to demand higher yields especially on longer-term bonds. To conclude, the sharp upward move in both of these charts is a signal that inflation expectations have begun to rise.
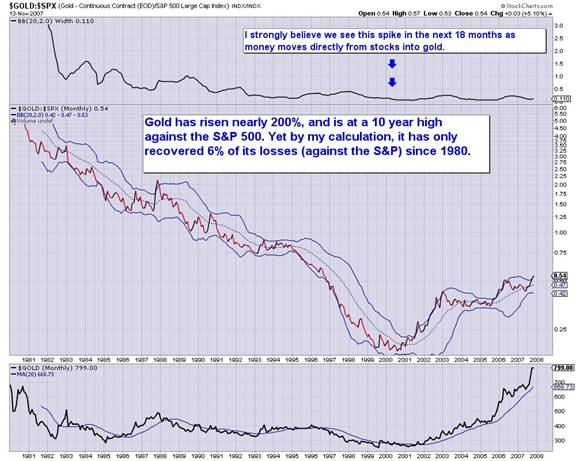
To put the above into proper context, I must show a long term Gold/S&P 500 chart. Below you can see that inflation expectations (using Gold/S&P 500 as your guide), although at a 10 year high can rise much higher.
How have the events of the past few months (credit crunch, liquidity injections, interest rate cuts) and the outcome of rising inflation expectations impacted certain sectors of the market?
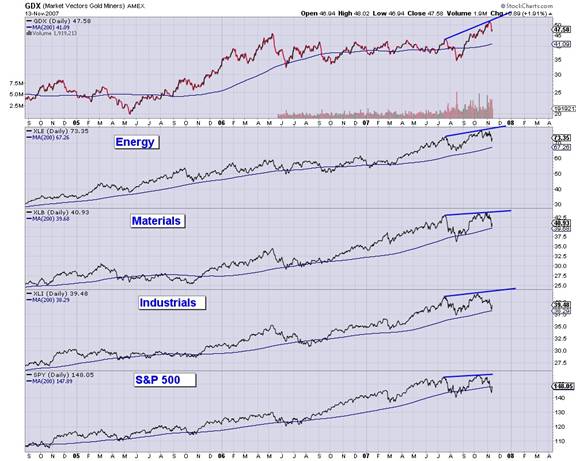
In the following chart I show various sector exchange-traded funds. From top to bottom and in order of recent strength we have gold stocks (gdx), energy (xle), materials (xlb), industrials (xli) and the S&P 500 (spy). Two ways you can gauge recent strength are looking at the distance between the July and November highs and also looking at the distance between the current price and the 200-day moving average. Only the energy and gold ETFs have made material gains since late July and only they are comfortably above their 200-day moving averages. Also, note the trend in the 200-day moving averages. That average in the charts of the S&P 500, Materials and Industrials has been rising for several years indicating a mature trend. Energy's 200-day moving average has only been rising for seven months and gold's for only a month.
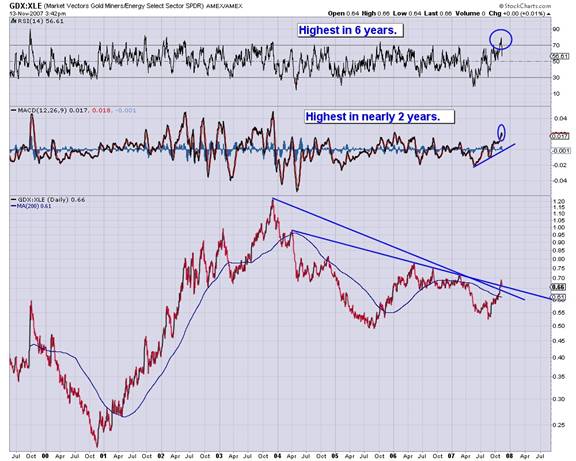
While gold and energy are preferred I do want to make it clear that at this juncture I prefer precious metals to energy. Below is a chart of the GDX/XLE (energy and gold stock ETFs). Energy stocks have outperformed gold stocks over the past four years but the ratio has emerged from a double bottom and appears to be breaking out. Rsi and Macd are good leading indicators, as momentum tends to bottom and strengthen before price. Rsi and Macd are near multi-year highs and that suggests that the gold stocks should soon outperform the energy stocks.
To put it all together, inflation expectations are set to soar in 2008 and the chief beneficiary will be precious metals and precious metals stocks. These various charts show that the PMs have assumed leadership since August and that leadership should continue for quite a while.
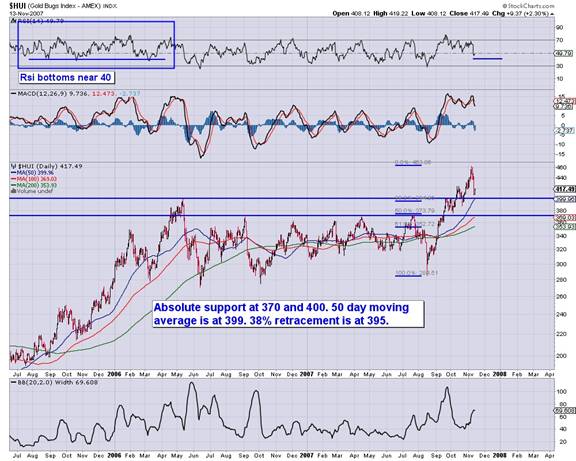
Currently the gold stocks are in corrective mode. The daily chart below shows a confluence of support around 400. The 38% retracement from the August low to the recent high is 395. The 50-day moving average is at 399 and 400 marks the previous high. Monday's nasty decline took the HUI down to 408 but it was able to rebound on Tuesday. In terms of magnitude this correction is almost complete. The duration is harder to judge.
Finally, I'd like to mention that in the newsletter I am now covering (via technical analysis) over 150 commodity stocks. I focus on a specific group (gold/silver/energy/base metals) every week. You can signup for free on the newsletter page of my website.
By Jordan Roy-Byrne
trendsman@trendsman.com
Editor of Trendsman Newsletter
http://trendsman.com
Trendsman” is an affiliate member of the Market Technicians Association (MTA) and is enrolled in their CMT Program, which certifies professionals in the field of technical analysis. He will be taking the final exam in Spring 07. Trendsman focuses on technical analysis but analyzes fundamentals and investor psychology in tandem with the charts. He credits his success to an immense love of the markets and an insatiable thirst for knowledge and profits.
Jordan Roy-Byrne Archive |
© 2005-2022 http://www.MarketOracle.co.uk - The Market Oracle is a FREE Daily Financial Markets Analysis & Forecasting online publication.