Stock Market Elliott Wave Patterns, Quick Primer on OEW
Stock-Markets / Elliott Wave Theory Apr 20, 2011 - 01:30 AM GMTBy: Tony_Caldaro
 We received a request over the weekend to provide a bit more detail about OEW labeling. OEW applies most of the same terminology as standard EW with one major exception. We added a Major wave between the Primary and Intermediate degrees. It makes more sense, to us, that a Minor wave should be complemented by a Major wave with an Intermediate wave in between them. Our labeling scheme is provided below:
Labeling: LEGEND
tentative labeling … green
Supercycle … shocking blue … SC
Cycle … light blue … C
Primary … blue … I
Major … black … 1
Intermediate … purple … i
Minor … dark blue … 1
Minute … dark green … i
Micro … orange … 1
Nano … gray … i
Pico … red … 1
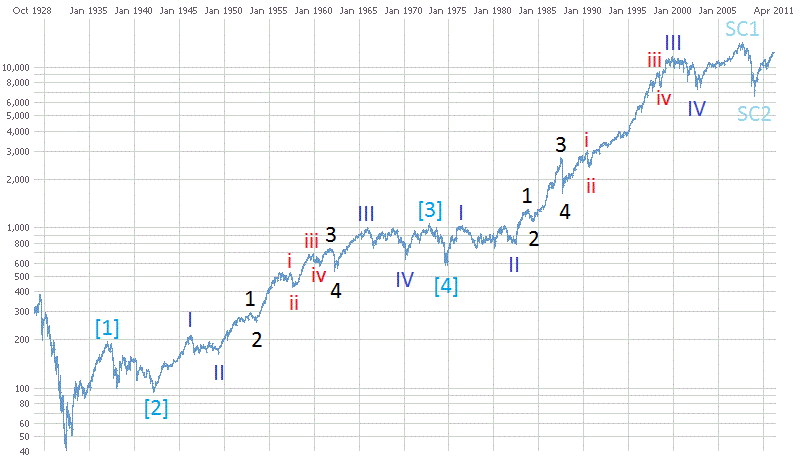
We provide an example of OEW labeling in a bull market with the chart below. This is the Supercycle wave between 1932 and 2007: labeled SC1. Notice Cycle waves [1] and [2] completed between 1937 and 1942, then Cycle waves [3] and [4] ended between 1973 and 1974. Cycle wave [5] completed at the Supercycle wave SC1 top in 2007. Now notice, Cycle wave [1] was simple, and Cycle waves [3] and [5] both subdivided into five Primary waves. In each of these extended Cycle waves, both Primary waves I and V were simple but Primary wave III subdivided into five Major waves. The last observation is that Major wave 3, of Primary III, of Cycle [3] subdivided into five Intermediate waves. While Major wave 5, of Primary III, of Cycle [5] subdivided into five Intermediate waves. This chart offers an example of how bull markets unfold over short and very long periods of time.

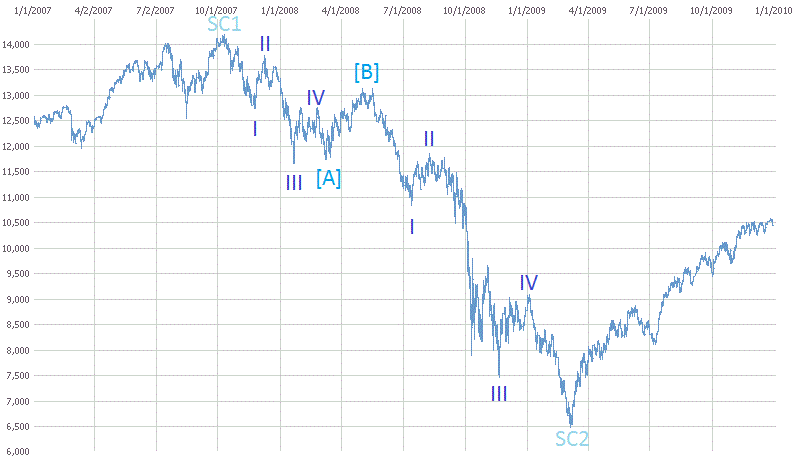
The next chart displays the typical OEW bear market labeling. It has been our observation that all bear markets are corrections to larger bull markets and thus unfold in ABC patterns. Simply put, bull markets consist of five wave advances, and bear markets consist of three wave declines. There are no five wave bear markets, nor three wave bull markets. Illustrated in the chart below is the 2007-2009 bear market consisting of three Cycle waves [A], [B] and [C], (which ended at the SC2 low). Cycle waves [A] and [C] each divided into five Primary waves. Therefore the entire bear market was a zigzag (5-3-5) of Supercycle degree. Naturally this bear market could have formed a flat (3-3-5), a triangle (3-3-3-3-3), or a complex three … which are all standard correction EW patterns.

To summarize, OEW added a Major wave in between the Primary and Intermediate waves. OEW also states that all bear markets are three wave corrections to larger bull markets. Finally, we state all waves are determined quantitatively by OEW, and the appropriate label is placed at the point of wave termination. We can only place final labels at the end of completed waves, not where we think they have ended. In other words, we do not use the market waves to fit our count, we count and label the waves the market creates. Best to your trading/investing.
CHARTS: http://stockcharts.com/...
http://caldaroew.spaces.live.com
After about 40 years of investing in the markets one learns that the markets are constantly changing, not only in price, but in what drives the markets. In the 1960s, the Nifty Fifty were the leaders of the stock market. In the 1970s, stock selection using Technical Analysis was important, as the market stayed with a trading range for the entire decade. In the 1980s, the market finally broke out of it doldrums, as the DOW broke through 1100 in 1982, and launched the greatest bull market on record.
Sharing is an important aspect of a life. Over 100 people have joined our group, from all walks of life, covering twenty three countries across the globe. It's been the most fun I have ever had in the market. Sharing uncommon knowledge, with investors. In hope of aiding them in finding their financial independence.
Copyright © 2011 Tony Caldaro - All Rights Reserved Disclaimer: The above is a matter of opinion provided for general information purposes only and is not intended as investment advice. Information and analysis above are derived from sources and utilising methods believed to be reliable, but we cannot accept responsibility for any losses you may incur as a result of this analysis. Individuals should consult with their personal financial advisors.
© 2005-2022 http://www.MarketOracle.co.uk - The Market Oracle is a FREE Daily Financial Markets Analysis & Forecasting online publication.


