


Stock Market May Require Further Consolidation Before Breaking to New Highs
Stock-Markets / Stock Markets 2011 Apr 18, 2011 - 02:32 AM GMTBy: Andre_Gratian

 Very Long-term trend – The continuing strength in the indices is causing me to question whether we are in a secular bear market or two consecutive bull/bear cycles. In any case, the very-long-term cycles are down and, if they make their lows when expected, there will be another steep and prolonged decline into 2014-15.
Long-term trend - In March 2009, the SPX began an upward move in the form of a bull market. Cycles and P&F projections point to a continuation of this trend for several more months.
SPX: Intermediate trend – The intermediate trend is still up and may already have resumed.
Analysis of the short-term trend is done on a daily basis with the help of hourly charts. It is an important adjunct to the analysis of daily and weekly charts which discusses the course of longer market trends.
Daily market analysis of the short term trend is reserved for subscribers. If you would like to sign up for a FREE 4-week trial period of daily comments, please let me know at ajg@cybertrails.com
Market Overview
The SPX 1250-1270 base gave us several potential P&F projections. The most conservative one of 1334 has already been filled and, as is the normal process, has been followed by a consolidation. This consolidation may be over or nearly over. The small distribution phase which formed at 1332 called for a retracement to about 1300, with a maximum of 1286.
Last Wednesday, the index touched 1302.42, re-bounded sharply from that level, and continued to rise into Friday. There is a good possibility that the low of the correction from 1339 has now been seen. However, a number of technical factors are suggesting that a pull-back will be needed before we can move higher. We’ll examine these in our analysis, but one of them is the fact that the QQQ may have suffered a minor set-back as a result of GOOG’s weakness on Friday and may need a small period of recuperation. Should the weakness exceed more than a few points, it could alter the scenario.
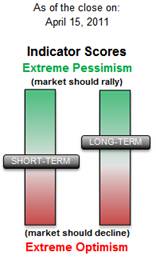
Sentiment is supportive of higher prices. The SentimenTrader has solid positive long-term readings, and the VIX does not show any inclination to start an uptrend. In fact, the VIX actually dropped while the SPX was correcting from 1339 to 1302. That was unusual behavior for this index which normally moves in the opposite direction from the equity indices.
I had suggested that Gold and oil may have reached projection highs which could cause them to correct, while the dollar was approaching a projection low. Both gold and oil pulled back for a couple of days, and the dollar has not done much, up or down. Let’s see what happens over the next couple of weeks.
Chart Analysis
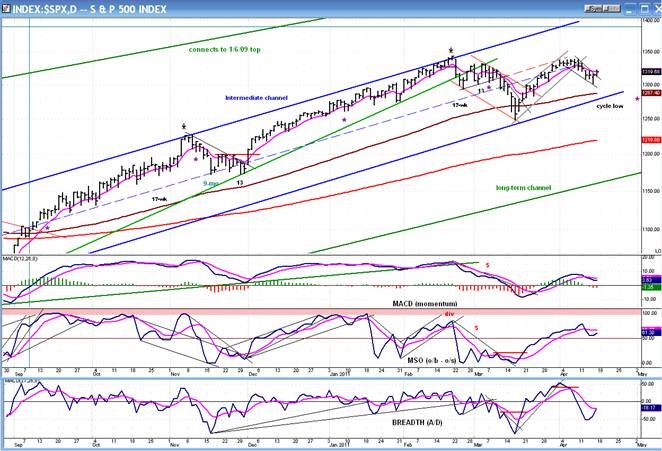
One of the reasons that I am cautious about calling for an end to the correction is that I don’t have a confirmation that we have reversed. The indicators of the weekly chart have not crossed and its MACD is still down-trending.
The indicators of the Daily Chart (below) have not given a buy signal either. Although the two lower ones have turned up with the price last week, all three indicators are still below their pink MA. Also, the price has not had enough upside momentum to close above its moving average. For these reasons -- and others that I will discuss when we analyze the hourly chart, it is best to see what happens next week before forecasting the resumption of the uptrend.
The intermediate uptrend does not show any sign of being jeopardized in any way. The 1249 low found support just above the bottom channel line and a good rally ensued. As long as the price action remains within the blue channel, the intermediate trend is intact and, since there are higher potential counts derived from the Point & Figure chart, it’s probably only a matter of needing some additional consolidation before the rally resumes.
Another cycle analyst has called for a cycle low next week. I tried to identify what cycle(s) he had in mind, and tentatively came up with a 36-wk cycle, which I now don’t believe is correct.
Let’s go to the Hourly Chart.
As I mentioned earlier, the base count between 1250 and 1270 carried an initial projection to 1334. The index reversed at 1339 (which was touched several times) to create the small distribution phase marked in red on the chart. That phase gave us two distinct targets: the first, a phase projection to about 1300, and the other, the full count to 1286. Because of the strong rally from 1302, last week, there is a good probability that this will remain the low of the correction. It would take some bad news to now push the market all the way down to the 1286 target.
Even if we do not have that much weakness, there are signs that more consolidation will be needed before we move higher. Besides the cycle projection and the fact that the QQQ looks even less ready than the SPX to extend its rally, neither index was able to move decisively above its correction channel (gray lines). Secondly, the A/D thrust which carried the 21-point rally was only half the strength of the one which caused the 3/16 reversal, suggesting that buyers were not ready to jump in wholeheartedly. Finally, if you look at the MSO indicator, note that it has become overbought and has started to turn down. If there is a cycle bottoming next week, it’s likely that the indicators will retrace one more time, to the lows of their ranges before turning up again. This could take two or three days to accomplish.
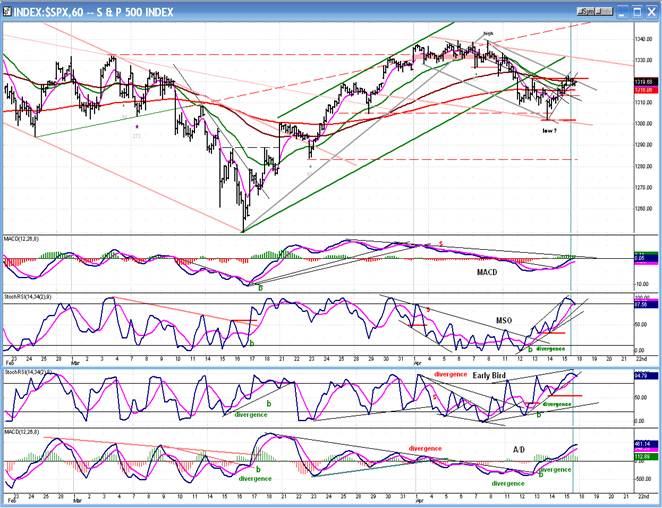
It is important to note, however, that none of the indicators has given a sell signal and, from that perspective, a further advance before they correct would not come as a surprise. Should there be such a move, the next target would be 1330.
This action would probably be associated with some sort of news event.
Projections
Because the base formation is capable of giving us higher projections, it is likely that the rally will eventually be extended to new highs. After the 1334 projection, the next one should carry the SPX at least 20 to 30 points higher.
Short-term, should the rally from 1302 continue before additional consolidation, the next target should be 1330.
Sentiment
The SentimenTrader (courtesy of same) dropped to neutral just a week ago. As a result of the minor correction, it has moved higher in the bullish area. It will have to get much more negative before it signals a top.
Dollar index
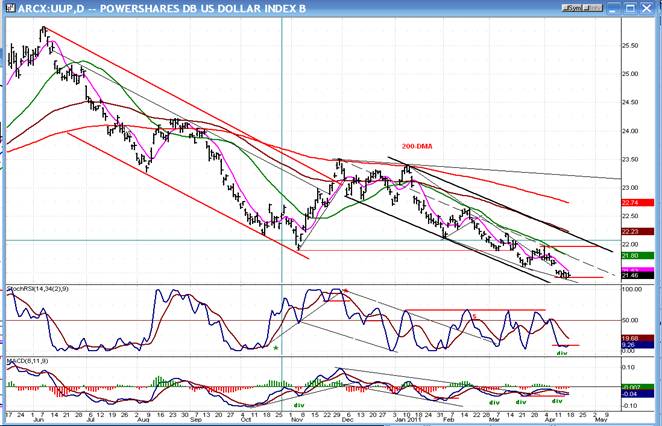
Above is a chart of UUP the dollar ETF. Last week, the dollar reached my 75 P&F projection and traded sideways for the rest of the week. Both UUP indicators are still showing some positive divergence, and the higher one looks as if it may be ready to turn up, but It is possible that 74-74.50 could be touched by the dollar, first.
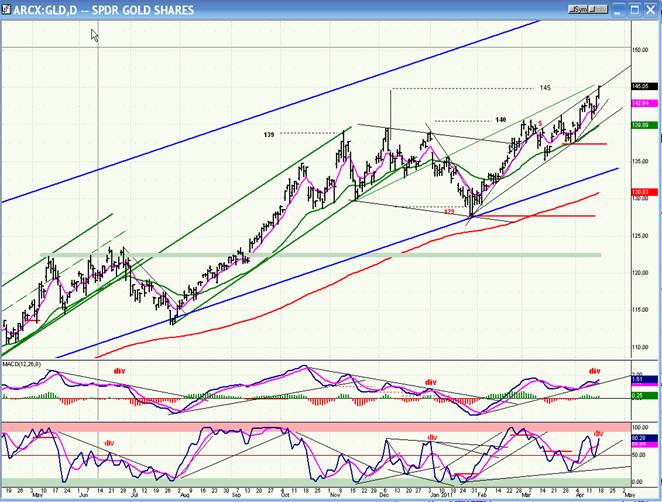
Gold
I had suggested a projection to 144-145 before GLD could find a top. After hitting 144, it reversed three points, but quickly moved higher to 145. The pull-back was not enough to break the MACD trend line and bring the price below 140, which is what would be required to signal a reversal.
If it should go beyond 145, the next target is 148-50.
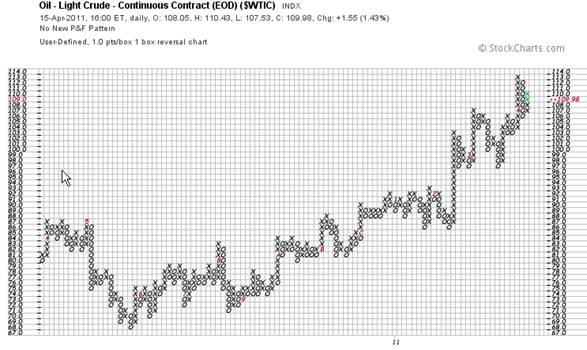
OIL
Last week, I mentioned that WTIC had a count to 115 when taken across the 76 level. So far, it has fallen a little short of that target, hitting a high of 113.88 before retracing 7 points. It is trying to move up again and we’ll soon find out if it intends to make it all the way to 115 or if this is only a rally to test the high. After reaching its target there should be a correction, but crude will eventually move higher before finding a substantial top.
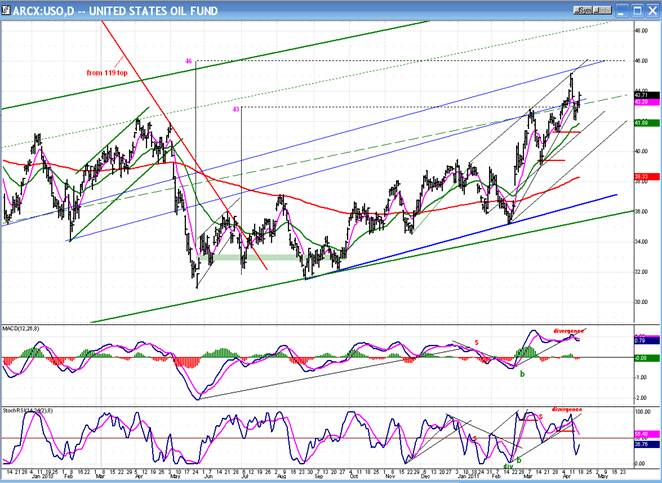
USO also did not quite reach its 46.00 projection before pulling back. It may still touch it before starting a more prolonged correction.
Summary
With a 21-point rebound, the SPX may have ended its minor correction from 1339. However, because of the factors cited above, additional consolidation may be required before pushing past the former highs.
Longer-term, the evidence points to higher prices before a significant top is made.
Andre
FREE TRIAL SUBSCRIPTON
If precision in market timing for all time frames is something which is important to you, you should consider a trial subscription to my service. It is free, and you will have four weeks to evaluate its worth.
For a FREE 4-week trial. Send an email to: ajg@cybertrails.com
For further subscription options, payment plans, and for important general information, I encourage you to visit my website at www.marketurningpoints.com. It contains summaries of my background, my investment and trading strategies and my unique method of intra-day communication with Market Turning Points subscribers.
By Andre Gratian
MarketTurningPoints.com
A market advisory service should be evaluated on the basis of its forecasting accuracy and cost. At $25.00 per month, this service is probably the best all-around value. Two areas of analysis that are unmatched anywhere else -- cycles (from 2.5-wk to 18-years and longer) and accurate, coordinated Point & Figure and Fibonacci projections -- are combined with other methodologies to bring you weekly reports and frequent daily updates.
“By the Law of Periodical Repetition, everything which has happened once must happen again, and again, and again -- and not capriciously, but at regular periods, and each thing in its own period, not another’s, and each obeying its own law … The same Nature which delights in periodical repetition in the sky is the Nature which orders the affairs of the earth. Let us not underrate the value of that hint.” -- Mark Twain
You may also want to visit the Market Turning Points website to familiarize yourself with my philosophy and strategy.www.marketurningpoints.com
Disclaimer - The above comments about the financial markets are based purely on what I consider to be sound technical analysis principles uncompromised by fundamental considerations. They represent my own opinion and are not meant to be construed as trading or investment advice, but are offered as an analytical point of view which might be of interest to those who follow stock market cycles and technical analysis.
Andre Gratian Archive |
© 2005-2022 http://www.MarketOracle.co.uk - The Market Oracle is a FREE Daily Financial Markets Analysis & Forecasting online publication.