


JP Morgan Q1 2011 Earnings
Companies / Corporate Earnings Apr 13, 2011 - 01:06 PM GMTBy: Tony_Pallotta

 On the headline JP Morgan (JPM) beat with $1.28 versus estimates of $1.15 on EPS. Comparing Q1 2011 to Q1 2010 net revenues is down 8.8% while EPS is up 72%.
Sounds OK unless you ask two very simple questions (1) what is the direction of income before provisions for loan losses and (2) what is the direction of asset prices.
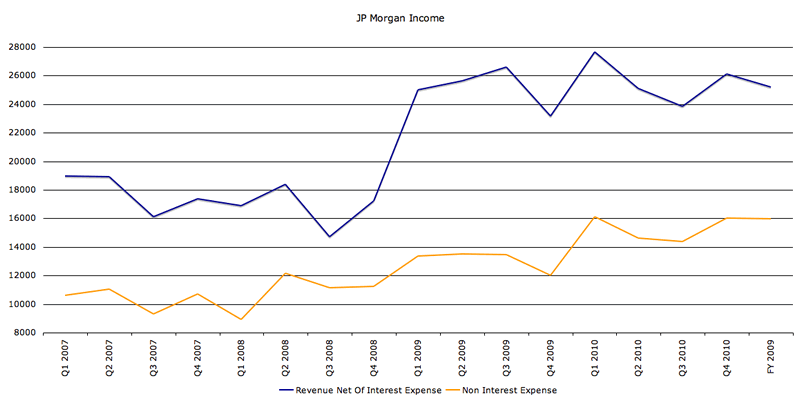
Question 1 - What is the direction of income before provisions. Comparing Q1 2011 versus Q1 2010, JPM income before provisions for credit losses is down 20.1%. The chart below shows revenue net of interest expense (blue line) which is declining, while non interest expense (yellow line) is moving higher. the difference is what remains to cover future loan losses.
Q1 2011 versus Q1 2010 shows sales declining 8.8% and net income before provisions down an even larger 20.1%. Bottom line the bank's ability to absorb future losses is deteriorating.
Question 2 - What is the direction of asset prices. Banks right now say it is improving and thus they are lowering reserves for credit losses. In Q1 2010 JPM reserved 5.3% for future loan losses. In Q1 2011 they have 4.3% reserved, a 19% reduction in reserves rates. Housing data shows prices have begun a second leg down though. Credit card delinquency rates continue to fall but for many credit cards are the only remaining source of credit and thus will be paid before a mortgage (buy groceries and gas on a credit card or make your mortgage payment).
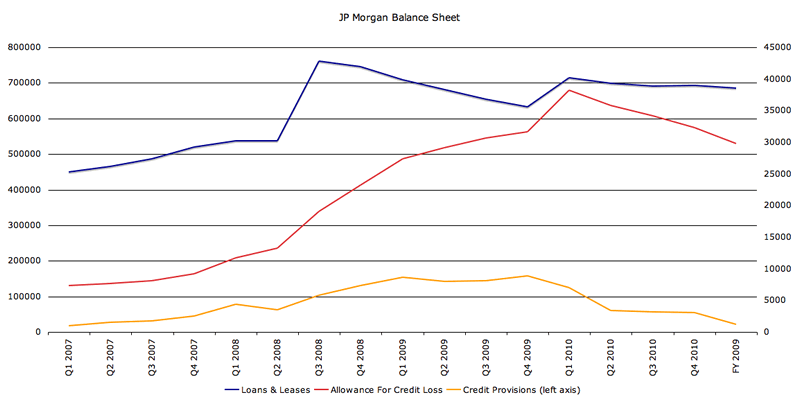
The chart below shows total loans and leases (blue line) which is flat, reserves for credit losses (red line) which is falling and provisions for loan losses (yellow line) which is almost non existent now and in fact could go negative.
Time will only tell what the real answer to question 2 is regarding the direction of asset prices. Right now it appears the trend is lower. If in fact that is the case then the deteriorating income of JPM and other banks will not be able to absorb rising provisions for loan losses. The bank trade really comes down to a bet on housing. So beyond FASB accounting tricks, government intervention and regulatory slaps on the wrist, the free market will have the final say on the future of the banking sector.
By Tony Pallotta
Bio: A Boston native, I now live in Denver, Colorado with my wife and two little girls. I trade for a living and primarily focus on options. I love selling theta and vega and taking the other side of a trade. I have a solid technical analysis background but much prefer the macro trade. Being able to combine both skills and an understanding of my "emotional capital" has helped me in my career.
© 2011 Copyright Tony Pallotta - Disclaimer: The above is a matter of opinion provided for general information purposes only and is not intended as investment advice. Information and analysis above are derived from sources and utilising methods believed to be reliable, but we cannot accept responsibility for any losses you may incur as a result of this analysis. Individuals should consult with their personal financial advisors.
© 2005-2022 http://www.MarketOracle.co.uk - The Market Oracle is a FREE Daily Financial Markets Analysis & Forecasting online publication.