Option Flexibility Allows Traders To Adjust Positions As Stock Market Changes
Stock-Markets / Options & Warrants Apr 11, 2011 - 10:24 AM GMTBy: J_W_Jones
 “I’ve been hanging onto nothing when nothing could be worse” Heaven When We’re Home The Wailin’ Jennys
As an options trader, I continue to be impressed by the wide variety of choices available to modify a trade that is not quite going the way I initially predicted. This approach may be a bit unfamiliar to the trader whose experience has been primarily with trading stocks. The choices for a stock trader are really only two: open or close a position.
The knowledgeable options trader can structure trades using one or more of the three primal forces of options to increase probabilities of success. These three factors are: time to expiration, implied volatility, and price of the underlying. If these variables are considered in the initial construction of a trade, the options trader can increase the probability of success of a trade. Even more remarkable is the ability to modify the physiology of an existing trade as a result of changing market dynamics.
I thought it would be helpful to examine a trade in which I have had to use several of these factors in order (perhaps) to avoid a loss. In discussing this trade which is still open, a position I have yet to know if will ultimately be profitable, you can begin to understand some of the fundamental concepts which guide an option trader’s decisions.
On March 29, I saw a pattern in X which I considered to be modestly bullish. X is a very liquid stock and as often the case; this liquidity is accompanied by an actively traded options board. In considering my many choices of how to structure this position, I chose to focus on what has been the defining characteristic of the market during early 2011-the low volatility environment.
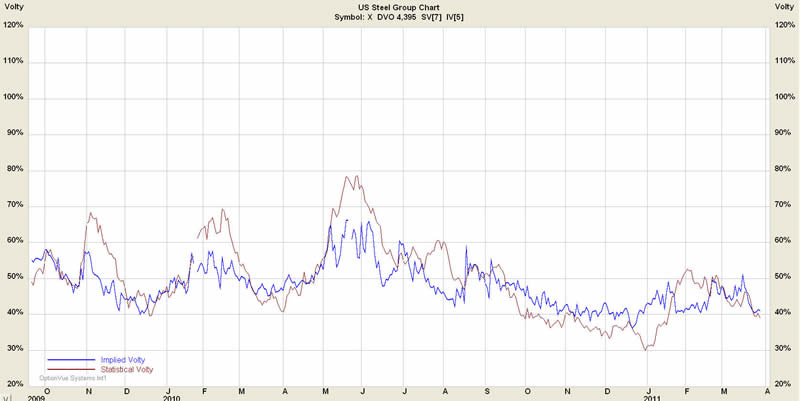
Most traders are familiar with the VIX being reflective of general market implied volatility, but when considering trade structure it is important to realize there is an implied volatility history for each underlying for which options are traded. A graphical display of such a history is embedded below:

It is clear that X is currently in its lower range of implied volatility. If I want to put as much wind at my back as possible, my objective in every trade, it would be smart to select a structure from the group of trades that benefits from stable or rising volatility. The core knowledge is that implied volatility is well known to be mean reverting and in this case reversion to the mean would result in a rising implied volatility.
One of the best trade structures in a low volatility environment is the calendar trade. In the vernacular of an options trader, it is a “positive vega trade”. In plain talk, this means the trade benefits from increasing volatility.
A calendar trade is constructed by selling a shorter dated option and buying a longer dated option. These options are of the same type; either puts or calls, and is established at the same strike price. The profit curve typically shows a variably broad zone of profitability that reaches its maximum at expiration when the underlying is at the strike price chosen. Because maximum profit occurs at the strike price selected, a directional bias can be established by choosing the appropriate strike.
Risk factors in this trade are two:
1. Price movement beyond the bounds of profitability.
2. Collapse of implied volatility in the long options leg of the structure.
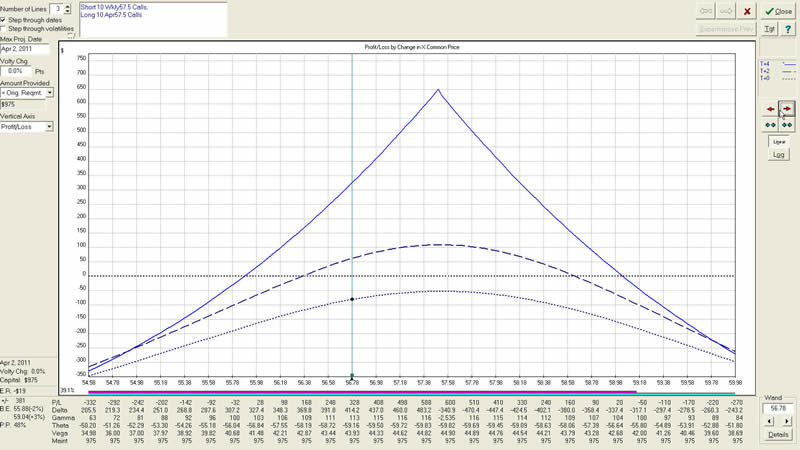
In this case, I chose to establish the calendar at the 57.50 strike when the stock was trading at around 56.50. I put the wind at my back a bit by selling the weekly call at a price of 70¢ and a volatility of 38.5% and buying the monthly call at 36.6%. This volatility skew served to reduce my exposure to volatility collapse in the long leg and broaden the range of profitability a bit. The initial P&L graph for the trade is presented below:

Unfortunately, within 48 hours, the price of X had fallen significantly as a result of a negative analyst recommendation. The short option I had sold was now trading at 3¢. I bought these back for a net credit of 67¢ and remained long the original calls I purchased.
When options you are short trade at less than 10% of the original price at which they were sold, only bad things can happen if you keep them open. Such options MUST be closed regardless of other adjustments you may choose to make. If you choose not to do so, in the words of the Wailin’ Jennys, you will be hanging on to nothing when nothing could be worse.
Following this fundamental tenet, I closed the options, and sold the next week’s option at the same strike short for a net credit of 24¢. On April 5, price had continued to go down; my adjustment was to buy back these calls for 13¢, booking an additional credit of 11¢.
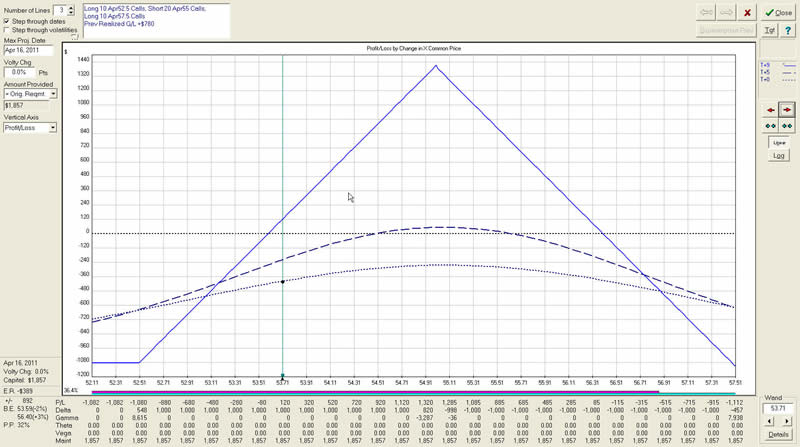
I then chose to convert the trade to a butterfly structure in order to improve the odds of success. My current trade structure is displayed in the graph below. I do not know if this trade will be economically successful, but it represents an exercise in using the dynamic potential of options to accommodate the current “real world” situation.

This trade may or may not work out economically, but it represents a characteristic example of the ability of dynamic use of options to mitigate losses from what turns out to be an initially incorrect hypothesis regarding future price movement. Stay tuned for the outcome; I will be monitoring it closely.
Get My Trade Ideas Here: http://www.optionstradingsignals.com/profitable-options-solutions.php
J.W. Jones is an independent options trader using multiple forms of analysis to guide his option trading strategies. Jones has an extensive background in portfolio analysis and analytics as well as risk analysis. J.W. strives to reach traders that are missing opportunities trading options and commits to writing content which is not only educational, but entertaining as well. Regular readers will develop the knowledge and skills to trade options competently over time. Jones focuses on writing spreads in situations where risk is clearly defined and high potential returns can be realized.
This article is intended solely for information purposes. The opinions are those of the author only. Please conduct further research and consult your financial advisor before making any investment/trading decision. No responsibility can be accepted for losses that may result as a consequence of trading on the basis of this analysis.
© 2005-2022 http://www.MarketOracle.co.uk - The Market Oracle is a FREE Daily Financial Markets Analysis & Forecasting online publication.


