


The Trading Game - 150+ Years of Grand Super Cycle Advance is Still Alive and Well
Stock-Markets / Elliott Wave Theory Nov 12, 2007 - 11:07 AM GMTBy: Joseph_Russo

Classic Elliott Wave Theory implies that there are nine degrees of trend that drive the broad based indices.
The trend that most are concerned with is the long-term or Primary Trend.
It is our view that the Primary Trend correlates with what many perceive as the larger “secular” vs “cyclical” trends commonly present in broad based indices.
Should one pause to consider the magnitude and duration of such cycles, one is better able to understand the high level of frequency in which many analysts prematurely conclude that a larger degree terminal has crested.
Given the average human lifespan, one must take into account that properly observing trends above Cycle and Super-Cycle degree are analogous to timing and monitoring the slow and gradual evolution of a life form.
Though rather tempting, one must not rush to judgment upon all visually apparent completions of five-wave advances that may be discernable on a scant 10-years of price data. To do so effectively, one must consider ALL recorded price data (as far back as 1693; British All-Shares Index), and assess the overall relative duration, pattern, and magnitudes accordingly.
BEYOND SECULAR
Three larger degrees of trend exist above the Primary or Secular Trends. The larger terminals residing above the Primary trend (Cycle, Super-Cycle, and Grand-Super-Cycle) carry immense sustainable force (once crested) to completely destroy all previous paradigms and protocol associated with long-term buy and hold, dollar-cost averaging, and all other commonly held long-term optimism strategies relative to the perpetual (mostly inflationary) rise in equity values.
DURATIONS and TIME HORIZON
Relative to the extended duration of the present grand-cyclical advance, we are currently in the maturing stages of an epic 150+-year bull-market-run at Grand Super Cycle Degree.
Casting price aside, two questions loom rather large. First, how much longer might the Grand-Super-Bull run, and secondly, once crested, how much relative “time” might be required to “correct” a 150+ -year advance.
If one were to assume such a grand cyclical correction might last up to 1/3 the length of its advance, one might anticipate the plausibility of a Grand Super Cycle “correction” lasting 50-years or more! A correction of such duration would be critical to US competitive survival.
At Primary Degree or above, identifying critical long-term peaks in equity values is of obvious vital importance to long-term investors of every type. Rest assured, our clients will be the first to know when and where such epic terminals may possibly present and confirm themselves.
Following a short-term trading summary, our general market-update will briefly comment on various portions of longer-term trends currently in progress.
Alternately, TRADING IS ALL ABOUT an ENDLESS SUCCESSION of TOPS and BOTTOMS
Short-Term Traders need not be concerned with larger degree terminals. Beyond aggressive Position-Trading and the pyramiding of such bets, shorter-term traders need only be concerned with the immediate direction and intent of a given price series.
ABSOLUTE TOPS or BOTTOMS have NO REAL MEANING to SHORT-TERM TRADERS
That a sudden one-day 22% price decline like that of the epic '87 crash can virtually disappear amid a grand super cycle uptrend, provides testament that traders should refrain from being motivated by pending prospects of such terminal import either nearing or having passed. Instead, traders only need focus on the price-action at hand – and to do so in accordance with ones risk tolerance, trading style, and money management disciplines firmly in place.
Doing so with a proper guidance system of benchmark rules and boundaries will limit drawdowns, and assure booking much larger/regular profits more often than posting the inevitable share of smaller losses that come with the territory.
Secondly, such practice fosters strict profit taking disciplines vs the naturally seductive psychology of assuming that a position will eventually “come-back”, or run in ones favor indefinitely – which is a sure-fire way to witness a profitable trade turn into a loser.
With that said, lets look at the short-term progress of the Dow.
Short-Term Trading Summary
Below is a graphical depiction of typical trade-triggers and price-target objectives regularly identified via Elliott Wave Technology's Near Term Outlook .
Our work regularly presents clear visual entry points with specific price-targets. Bear in mind however, that although we have defined three levels of drawdown along with the respective risk/reward ratios for each of the three trade triggers noted in the chart below, that we do not issue specific trade instructions with stops or stop management guidance.
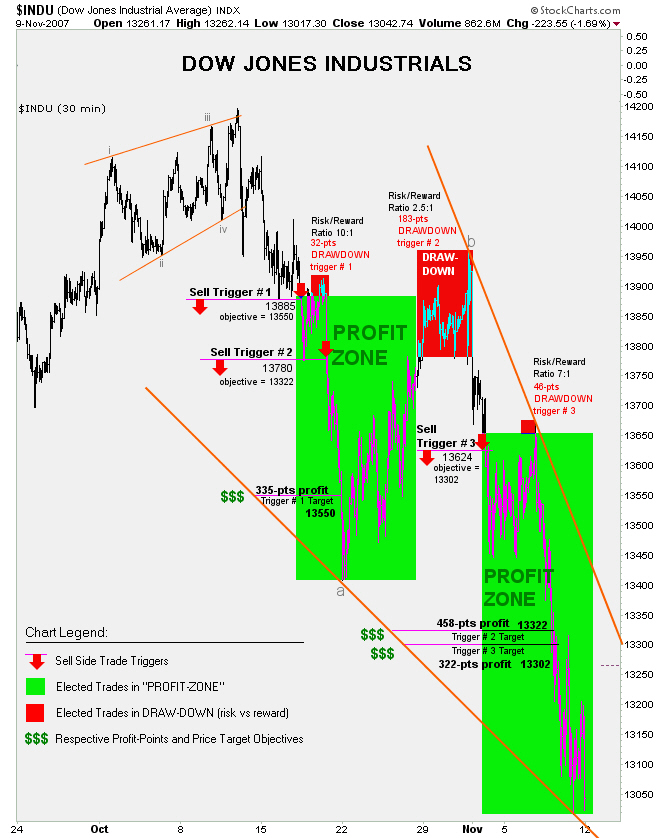
The chart above is not a working price chart, but rather a graphical summary created to reflect rather typical results of our ongoing analysis.
To review a sample of our working price charts, one may recall our previous article entitled “ Opportunity Knocks .”
Three Typical Trades in Brief
Note that our first sell-trigger elected on breach of 13885 carried a predetermined downside price objective of 13550 or 335-points (2.41%). Upon election, price moved down over 90-pts before reversing higher into drawdown of 32-points prior to resuming path directly toward capturing the 13550 target.
The second sell trigger began equally rewarding upon election at a breach of 13780. This particular trade-trigger had a predetermined price objective of 13332 or 458-points (3.32%). After electing shorts at 13780, the market plunged some 350-pts before temporarily basing just above 13400. Should ones trading style and money management criteria permitted (holding short - risking a 2.5:1 ratio of 183-pts loss vs 458-pts profit) this rather challenging trade also went on to capture its downside price objective at 13322.
Similar activity can be observed in our third sell trigger whereby the market initially went in the desired direction (a very good omen by the way) , then suddenly reversed in common attempt to spook as many shorts as possible from their positions. This third trigger elected on breach of 13624 and carried a predetermined price objective of 13302 or 322-points (2.36%). After moving down generously some 175-pts post election, the decline came to an abrupt halt then proceeded to chop and grinded higher all the way back to the initial entry plus 46-points of drawdown. Once enough weak-handed traders likely covered upon watching 175-pts profit morph to nearly 50-pts of loss, the market proceeded to plunge over 600-pts easily capturing the downside price objective at 13302.
Moving from the short-term progressions, let us now take look at some of the longer-range prospects for the markets:
Broad market update
Our long-view charts below observe a various mix of trends at Primary Degree.
Long-Term Trends: The NASDAQ 100
The NDX:STALLING at 2200
In our previous article, we noted that:
“Just shy of testing a five-year upper trend channel boundary, this formerly wiped-out index is still struggling in recovery mode.
Currently, despite all the rage, the NDX is over-extended. Another little heads-up is that bullish percents for the NDX registered a clean sector-wide 6% sell-signal reversal after Friday's rout.
Short of a very controlled hyperinflationary dollar collapse - forcing equities to adjust higher in response - upside progress is likely to be limited over the very near-term.“
The NDX hit that upper trend-channel boundary and backed-off considerably thereafter. Note that there is still more room on the upside prior to encountering resistance at the upper boundary associated with the larger Intermediate Degree downtrend channel. Short-Term price-action will govern whether the NDX encounters this overhead resistance at fresh highs for the move or beneath recent highs - further out in time.
Looking out toward 2008 from current levels, the NDX has complete liberty to traverse anywhere from 1100 to 3000. At present, and until such time as the 1750 level fails, the short and long-term uptrends shall remain in tact.
Our previously noted what-if scenario for the dollar is looking frighteningly more plausible with each passing week.
If currencies were to be held to similar forthcoming valuation standards imposed by FASB, we wonder if ALL fiat currencies would fall under the new “LEVEL III” mark-to-model junk status .
Given that they are marked to market via GOLD by default, it appears that massive write-downs are already occurring in the largest of global sub-prime markets – INFLATABLE (debt-based) FIAT Currencies.
Here we show The Dow on path toward testing a smaller degree uptrend at 13K, with room to work its way down toward the mid 12k-level prior to testing its larger degree of trend.
Looking out toward 2008 from current levels, the Dow has liberty to traverse anywhere from 10K to 15K. At present, and until such time as the 10K level fails, the Dow's long-term uptrend shall remain in tact.
In recent contrast to the NDX, Gold has hurdled and posted a decisive close above its eight-year upper trend channel boundary. Although a sudden dollar rally could easily shake Gold back down to retest the critical-mass breakout level at 730, we are nonetheless compelled to measure the recent trend channel “jump” as a potential mid-line to a much wider up-trend channel.
The S&P is in a bit more of a precarious position when compared to the unequivocal pack-leadership displayed in the Dow. Whereas the Dow is approaching test of a smaller degree trendline, the S&P has only its larger degree trend line to fall back on.
Looking out toward 2008 from current levels, the S&P has liberty to traverse anywhere from 1050 to 1650. At present, and until such time as the 1050 level fails, the S&P's long-term uptrend shall remain in tact.
“No matter ones time-horizon, both Risk and Opportunity are continuously present amid inherently speculative financial markets”
The Near Term Outlook covers the short-term Dow, S&P, and NDX five-days-per-week, and issues near-term/long-range updates for the Dollar, Gold, Crude Oil, and the HUI two times per week.
Until next time,
Trade Better / Invest Smarter...
By Joseph Russo
Chief Editor and Technical Analyst
Elliott Wave Technology
Copyright © 2007 Elliott Wave Technology. All Rights Reserved.
Joseph Russo, presently the Publisher and Chief Market analyst for Elliott Wave Technology, has been studying Elliott Wave Theory, and the Technical Analysis of Financial Markets since 1991 and currently maintains active member status in the "Market Technicians Association." Joe continues to expand his body of knowledge through the MTA's accredited CMT program.
Joseph Russo Archive |
© 2005-2022 http://www.MarketOracle.co.uk - The Market Oracle is a FREE Daily Financial Markets Analysis & Forecasting online publication.
Comments
|
Peter Brown
31 Jul 08, 18:57 |
Elliott Wave
As at Augast 2008 are we staring down the end of THE Grand Supercycle? Regards from Australia! |