Breakouts in Gold and Silver Prices
Commodities / Gold and Silver 2011 Apr 09, 2011 - 01:15 AM GMT The story of gold is as rich, lustrous and complex as the metal itself. It is as ancient as the Egyptian Pharos and modern as the mirrors coated with gold which astronomers use to capture images of the universe. The metal's mounting value is connected directly to its economic role as a stable alternative to paper currencies, and its rise should speak volume about the health of the global monetary system.
John Maynard Keynes, the economic guru of many of today’s economists, called gold a “barbaric relic.” Lenin went even further. He suggested an ingenious way to demonetize gold. Under Communism gold would be used to plate the inner surfaces of public urinals. Lenin of course, had the means of preventing the people for making off with the urinals. He had the secret police. But neither Keynes nor Lenin has proven to be right. In fact, the way it’s going, it looks like it is paper money that is going to the toilet.
The philosophical thought associated with valuation of gold is always a talk of interest. Now, let’s move on to something very particular to gold. Here are few interesting numbers with respect to gold.
- The total number of tons of gold mined since the beginning of civilization is 165,000, which would fit into a crate of 20.4 meter on a side (about 8500 cubic meters). More than 90 percent of that has been mined since the California Gold Rush.
- The number of grams in a troy ounce of gold is 31.103
- How much is 100,000 talents (one of several ancient units of mass) of gold? Since a talent is considered to be about 75 pounds, in today’s prices that would come to about $150 billion.
- The percentage of gold mined today to be used as jewelry is 60 %.
- The percentage increase in the price of gold from Dec 2000 to October 2010 is 394.
- The number of times gold has reached a new high in 2010 is 35.
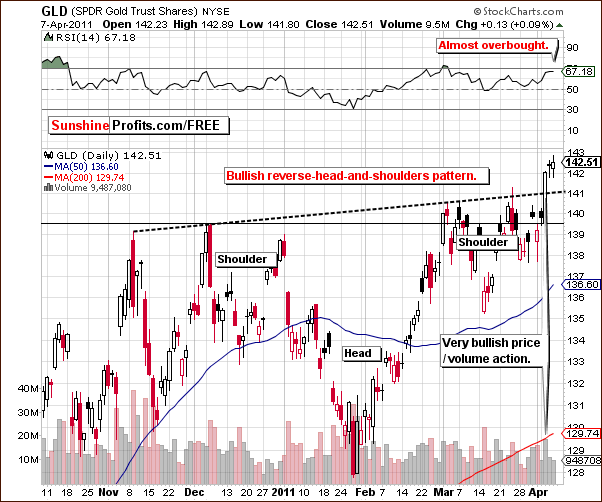
To see if gold might reach some new highs soon, let’s turn to the technical portion with analysis of market moves. We will start with the short-term GLD chart (charts courtesy by http://stockcharts.com.)

We begin with the short-term chart for the yellow metal since much attention has been focused here these days. Although there has been a confirmation in the form of high volume, we didn't felt enough proof has been seen. Therefore we have decided to wait a few more days to see if these price levels will manage to hold and give us more peace of mind (lowering the risk parameter in the risk/reward ratio). Thursday was the third consecutive day above a critical resistance/support line and the recent breakout has been verified by high volume levels. The trend is clearly bullish.
Another bit of bullish news comes from the completion of a reverse head-and-shoulders pattern formation. A further rally (even a $100+ one) from here appears quite possible. Although the RSI levels are nearly overbought and this is somewhat negative, the bullish developments seem strong enough to override this factor. RSI levels alone simply do not seem capable of keeping this rally in check.

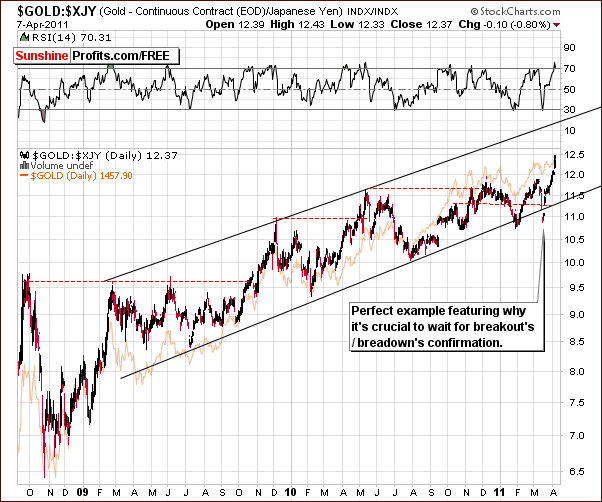
Looking at the chart for gold in terms of the Japanese yen this week, the most important point we wish to make is in regards to waiting for confirmations of breakouts and breakdowns.
Recently, this index showed a breakdown below the lower border of the trading channel. Investors who sold without waiting on a confirmation of this move would have lost out since a quick rally was seen prior to a confirmation of the breakdown. In this case, patience was indeed a virtue for those who waited. In fact in one of our previous gold investment articles, we wrote that in case of the above chart the “breakdown” should not be viewed as a true bearish sign for gold.
Overall, based on the general bullish sentiment from nearly all of our gold charts this week, it seems that the time is right for opening speculative long positions in the yellow metal.
Let’s have a quick glance at the silver market too.

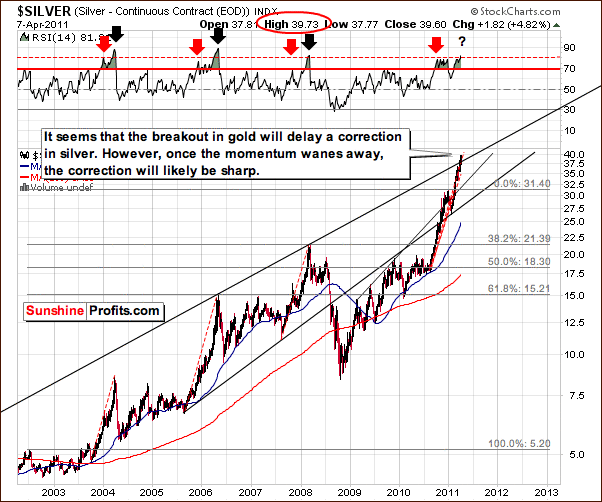
In the very-long-term chart for silver, we see a breakout above the rising long-term resistance line and this is a positive factor. The situation at this point, however, remains tense for several reasons.
The recent rally can be compared only to the rally of 2005-2006. At that time, the percentage rise was actually a bit higher which leaves open the possibility that this 2011 rally may continue a bit more. In fact, if a bigger rally is seen, then the 2010-2011 silver upswing would actually outperform the rally from 5 years ago. Consequently, it will set a new record in terms of percentage gains for a single rally.
The RSI levels and the size of the current rally suggest that a correction may be seen fairly soon. Furthermore, this correction is likely to be quite sharp. Investors should continue to monitor this situation closely and be prepared to exit the market once it turns unfavorable.
This is also in line with the True Seasonal tendencies of the white metal, a topic we discussed in our Premium Update March 31st 2011. “…an upward trend might occur in the first days of April after which we should be particularly cautious and look for signals of a possible slump. In the second half of the month prices of silver might drift sideways.”
Before summarizing, let’s turn towards the silver:gold ratio.

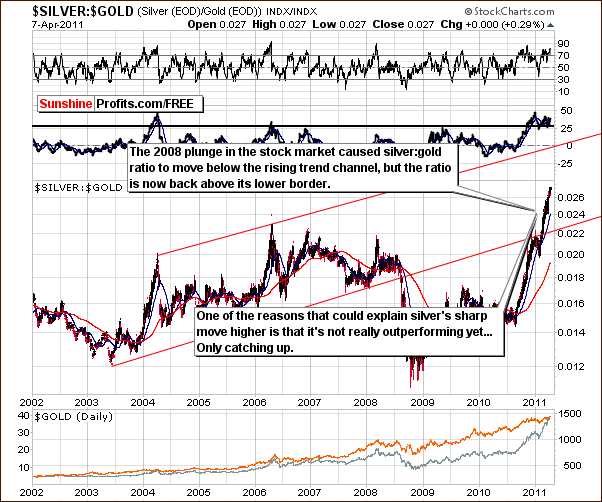
In the silver:gold ratio chart, we continue to see silver’s superior performance. While silver continues to outperform gold, the silver:gold ratio did not move to its resistance level (upper border of the rising trend channel) yet, so this trend may not reverse for some time.
Once silver:gold ratio gets to this particular level, it will be likely that a local top will be seen in the whole sector. Naturally, this does not mean that there will be no additional tops along the way.
Summing up, based on gold, silver and mining stocks alone, a rally from here appears to be in the cards.
To make sure that you are notified once the new features are implemented, and get immediate access to my free thoughts on the market, including information not available publicly, I urge you to sign up for my free e-mail list. Sign up today and you'll also get free, 7-day access to the Premium Sections on my website, including valuable tools and charts dedicated to serious PM Investors and Speculators. It's free and you may unsubscribe at any time.
Thank you for reading. Have a great and profitable week!
P. Radomski
Editor
Sunshine Profits
Interested in increasing your profits in the PM sector? Want to know which stocks to buy? Would you like to improve your risk/reward ratio?
Sunshine Profits provides professional support for precious metals Investors and Traders.
Apart from weekly Premium Updates and quick Market Alerts, members of the Sunshine Profits’ Premium Service gain access to Charts, Tools and Key Principles sections. Click the following link to find out how many benefits this means to you. Naturally, you may browse the sample version and easily sing-up for a free trial to see if the Premium Service meets your expectations.
All essays, research and information found above represent analyses and opinions of Mr. Radomski and Sunshine Profits' associates only. As such, it may prove wrong and be a subject to change without notice. Opinions and analyses were based on data available to authors of respective essays at the time of writing. Although the information provided above is based on careful research and sources that are believed to be accurate, Mr. Radomski and his associates do not guarantee the accuracy or thoroughness of the data or information reported. The opinions published above belong to Mr. Radomski or respective associates and are neither an offer nor a recommendation to purchase or sell securities. Mr. Radomski is not a Registered Securities Advisor. Mr. Radomski does not recommend services, products, business or investment in any company mentioned in any of his essays or reports. Materials published above have been prepared for your private use and their sole purpose is to educate readers about various investments.
By reading Mr. Radomski's essays or reports you fully agree that he will not be held responsible or liable for any decisions you make regarding any information provided in these essays or reports. Investing, trading and speculation in any financial markets may involve high risk of loss. We strongly advise that you consult a certified investment advisor and we encourage you to do your own research before making any investment decision. Mr. Radomski, Sunshine Profits' employees and affiliates as well as members of their families may have a short or long position in any securities, including those mentioned in any of the reports or essays, and may make additional purchases and/or sales of those securities without notice.
Przemyslaw Radomski Archive |
© 2005-2022 http://www.MarketOracle.co.uk - The Market Oracle is a FREE Daily Financial Markets Analysis & Forecasting online publication.


