How NOT To Lose Money Investing in Silver
Commodities / Gold & Silver Nov 11, 2007 - 01:47 AM GMTBy: Roland_Watson

 Silver has broken out of its correction phase, a new bull leg in silver has resumed and I am addressing the subject of losing money in silver. Have I gone mad or what? No and for two simple reasons which are displayed in graphical form below. The first is the silver spike of 2004 and the other is the silver spike of 2006.
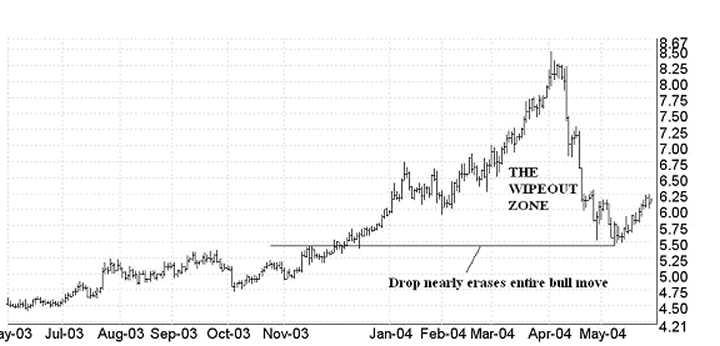
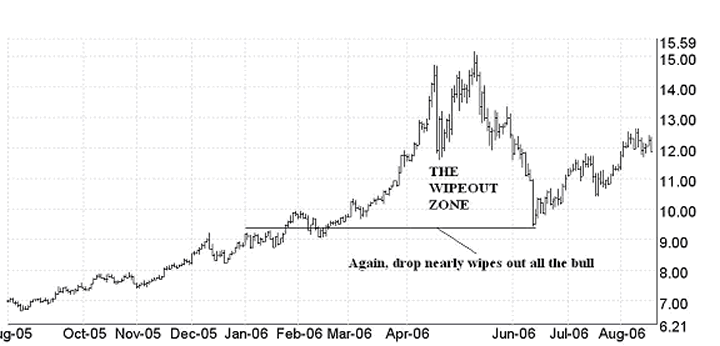
Note one miserable fact about these two bull markets in silver, the ensuing correction virtually wiped out all gains made in the preceding bull. I call it "The Wipeout Zone" and it is an area you want to spend as little time as possible in unless you want a major proportion of your silver profits reduced to zero.
Now you may say this time is different and silver may be more gentle to us poor silver investors. I say it is better to assume it will happen than not happen; anyone would be a fool to assume otherwise in my opinion. This game has to be played by past clues else we are just grasping for straws in the dark.
So what can be done to personally minimize the carnage that will undoubtedly follow? You have two options. The first option is to sit it out. If you believe silver is going to $100 or something like that in 10 years and you got in at $5 you may just be prepared to ignore these occasional price crashes. Just keep that glass of Scotch in your hand to steady your nerves.
Alternatively, you may not be a futures trader but neither do you wish to hold for 10 years or more. You need something that helps you to decide when to cash out some or all of your position. In that case, you need technical analysis. Fundamental analysis will not help you in the slightest in deciding an exit point, it only tells you that silver's overall future is bright, it is a blunt instrument.
Now anything out there that helps that decision-making is to be welcomed. No indicator is going to get you out on the exact day silver peaks but they ought to be considered and consulted if appropriate. Our silver focused newsletter uses several indicators, two of which are proprietary. The first is the RMAR indicator, which is a "relative" moving day average that simply divides the current price of silver by its 200 day moving average. The erudite Adam Hamilton of Zeal Intelligence introduced the basic model but we have refined it for use with silver to reduce the number of false flags. The back tested forty-year chart is shown below with the price of silver in red.
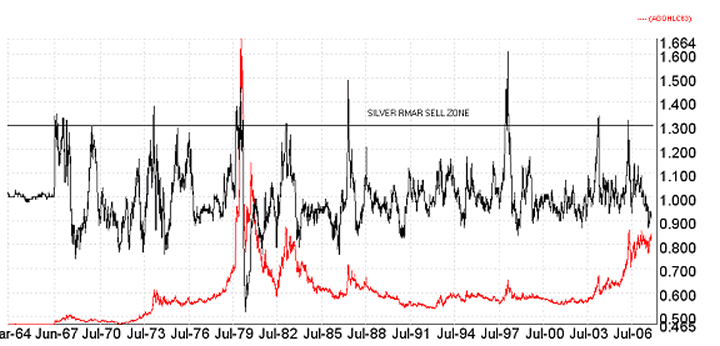
When the RMAR indicator goes above 1.300, it is time to consider selling silver. The performance table is given below.
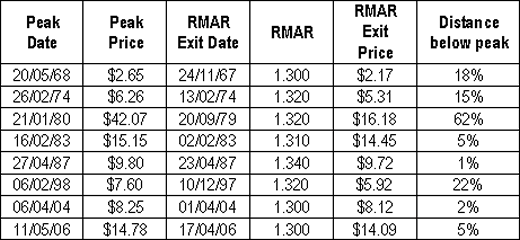
Several historic peaks in the price of silver have been tested with the corresponding exit dates and prices as triggered by the RMAR. The percentage difference between the actual peak price and the RMAR exit price is given in the last column. For example, on the last peak when silver hit about $15 in May 2006, the RMAR issued an exit signal at $14.09 or a mere 5% below the actual closing price peak of $14.78.
Allied with this indicator is our Silver Leverage Indicator or SLI, which was discovered by the author. The SLI works on the theory that silver can only outperform (or leverage) gold by a certain amount. This is a sell indicator that has only triggered THREE times in the last forty years. The back tested data is shown below with the silver price again in red.
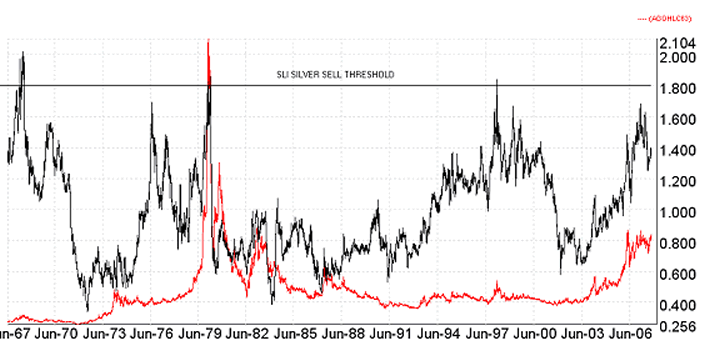
The performance table is again given below for these three sell signals.

This is historically a powerful indicator, which was only 4 days out in signaling the top of the 1980 silver bull market. Investors back then would have got out at $37 or so before silver crashed to $10. Whether silver will actually rise enough to trigger a new top with the SLI remains to be seen but if it happens, history say "get out!"
Silver Analyst subscribers are kept informed of these indicators as we approach yet another bull high in the months ahead. What people do with these numbers is up to them but I am confident that they have added value to their silver investment strategy. But how are you going to approach the great silver spike of 2008? Flip a coin each day? Consult a fortuneteller or use something with a track record? We recommend you add these indicators to your ultimate collection of decision-making items.
Silver is going higher but how much higher? The previous two bull legs saw silver double in price so we may be looking at $30 from a $15 breakout but remember this is the blow off phase and quite possibly anything could happen! Good luck to you as we saddle up for hopefully one of silver's all time great performances.
By Roland Watson
http://silveranalyst.blogspot.com
Further analysis of the SLI indicator and more can be obtained by going to our silver blog at http://silveranalyst.blogspot.com where readers can obtain the first issue of The Silver Analyst free and learn about subscription details. Comments and questions are also invited via email to silveranalysis@yahoo.co.uk .
Roland Watson Archive |
© 2005-2022 http://www.MarketOracle.co.uk - The Market Oracle is a FREE Daily Financial Markets Analysis & Forecasting online publication.


