


Solar Sun Spot Activity and the Financial Markets
Stock-Markets / Financial Markets 2011 Mar 30, 2011 - 10:13 AM GMTBy: John_Hampson

 In recent weeks we have seen surprisingly high solar activity, with sunspot readings over 100 on multiple days, shown below, red line.
Underlying Source: Jan Alvestad
To understand how high these readings are, the chart below forecasts average sunspots to peak under 100 at the height of the current solar cycle (which is named solar cycle 24).
Source: NOAA
So what are the implications of this sharp rise in sunspots? Well, I have annotated the first chart with two recent macro events.
Firstly, the Japanese Earthquake occured at a peak of solar activity. There is some historic correlation between solar activity and earthquakes, as shown below. Sunspots are the red line, earthquakes the black line.
As we are climbing up towards the peak of solar cycle 24, we may therefore see more incidences of earthquakes (also, note the longer term rising trend in quakes). In terms of impacts on the markets, much depends on how severe quakes are and whether they occur near centres of commerce or in remote areas. It is common though to experience multiple quakes in the same area once an initial event has increased the tectonic stress, so it may be prudent to hold back on seeing Japan as a current investment opportunity, in case further events follow. Otherwise, a little extra general caution in trading may be appropriate, if we should expect further earthquakes globally in the climb to the solar cycle peak but cannot predict where or when they might occur.
Secondly, esclation and spread of turmoil in the Middle East and North Africa also conicided with a peak in solar activity. Human mass excitability has been shown to correlate with peaks in solar activity, with A.L. Tchijevsky finding that 80% of the most siginificant historical human events occured within the years around the solar maximums, specifically "mass demonstration, riots, revolution, wars and resolution of most pressing demands". Again, as we approach the current cycle 24 peak we may therefore see more such activity, and in trading it may pay to be a little more cautious or to be a little more invested in a safe haven such as gold.
But rising sunspot implications don't stop there. Let's dive in a bit deeper.
--------------------------------------------------------------------------------
Cyclical planetary movement around the sun brings about cyclical swings in solar activity, with one solar cycle lasting an average of 11 years, sometimes as short as 9 years or as long as 13. Solar activity causes geomagnetic activity on Earth. There is a correlation between geomagnetism and depression and suicide in humans, and an increase in psychotic episodes in individuals who already suffer from unstable psychological states. Solar activity is also shown to make people more excitable, irritable and aggressive, and can affect melatonin synthesis, blood pressure, heart disease and light sensitivity.
Translated to the stock market, we see poorer average returns on days of significant geomagnetism. Increasing solar activity may therefore represent a headwind for the stocks bull.
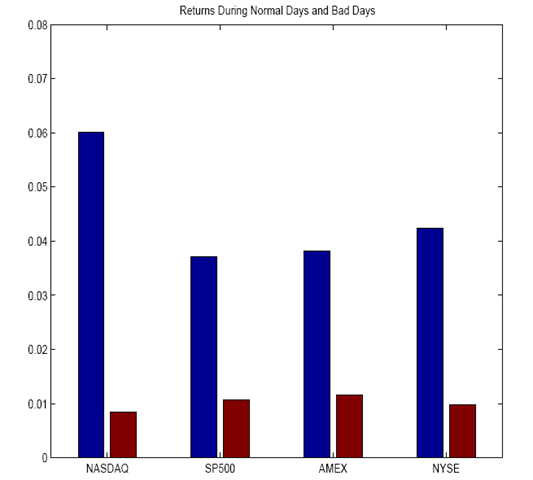
Source: Robotti / Krivelyova
Translated to economics, we see a correlation of peaks in inflation with solar activity peaks and a correlation in recessions following solar cycle maximums, as shown in the next 2 charts.
Source both: Amanita.at
Combining these two charts with the solar cycle 24 forecast chart, we arrive at a prediction of inflation increasing into a peak around 2013 followed by a recession. Note that the 2013 peak is only a forecast and as solar cycles vary in length around an average it it possible that the recent escalation in sunspots in recent weeks could make for a steeper trend to peak a little earlier, we shall see. Either way, it might be prudent to be now invested in assets that do well in an inflationary environment as we trend up to the peak, such as precious metals and energy.
In fact, if we look back historically at the secular swings between hard assets and paper (or stocks) then we find that the last 3 peaks in commodities relative to stocks occured at solar cycle peaks, around 1918, 1948 and 1980. I have labelled these 1, 2 and 3 in the two charts below.
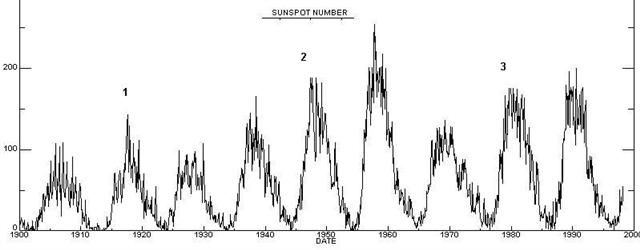
Source: Carl Moore
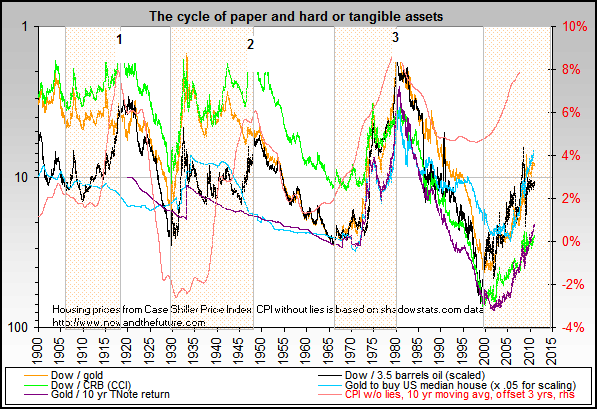
Source: Nowandthefuture
Every third solar cycle peak corresponded to a secular peak in tangible assets (such as gold and oil) in relation to paper assets, and the peak of solar cycle 24 will be the third since 1980, putting us on track for another relative peak in hard assets at the currently forecast cycle peak of 2013. Going further still, we can estimate the next commodities peak after that to be 3 further solar cycle peaks away at around 2046. Using secular averages, we could therefore estimate a secular commodities bull to occur from around 2030 to the mid 2040s, and working back, a secular stocks bull from around 2014 to 2030.
--------------------------------------------------------------------------------
In summary, the recent escalation in solar activity and the predicted trend to a solar cycle peak currently around 2013 suggests increased earthquakes, increased human excitability in the form of action and conflict, increasing inflation and rising relative returns in hard assets until a relative peak at the solar maximum, giving way to a new economic recession.
Specifically, the solar peak around 2013 should coincide with extremes for the Dow-gold and Dow-oil ratios and consumer price inflation, before a recession emerges in which commodities fall harder than stocks and in so doing the two asset classes begin their relative secular inversion.
John Hampson
John Hampson, UK / Self-taught full-time trading at the global macro level / Future Studies
www.amalgamator.co.uk / Forecasting By Amalgamation / Site launch 1st Feb 2011
© 2011 Copyright John Hampson - All Rights Reserved
Disclaimer: The above is a matter of opinion provided for general information purposes only and is not intended as investment advice. Information and analysis above are derived from sources and utilising methods believed to be reliable, but we cannot accept responsibility for any losses you may incur as a result of this analysis. Individuals should consult with their personal financial advisors.
© 2005-2022 http://www.MarketOracle.co.uk - The Market Oracle is a FREE Daily Financial Markets Analysis & Forecasting online publication.