Indian Stock Market Particularly Uncorrelated
Stock-Markets / India Mar 30, 2011 - 06:45 AM GMTBy: Submissions
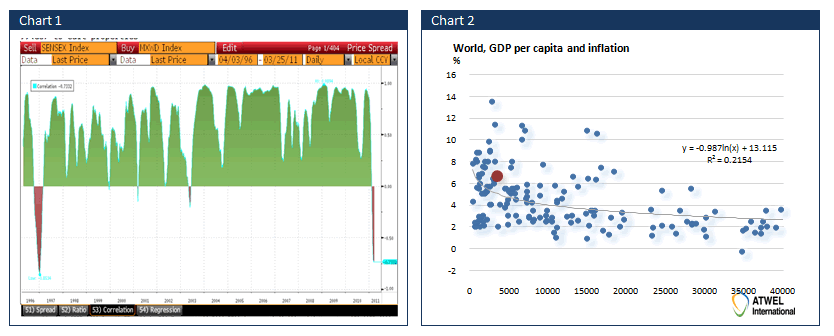
 Jan Kaska writes: Living in the correlated world, we were particularly struck when we saw a correlation chart between India and MSCI World turning deeply negative for the first time since 1996. While S&P is up 4% since the start of the year, Sensex has dived into deep red -8% territory.
To be honest, market timing is a painful exercise which we get rarely right. But we believe there is a growing probability of Sensex to stop underperforming and we would definitely start tipping our toes into long Indian equities, should it be Sensex itself or Indian small caps (ETF:SCIF).
Without doubt, the main reason for India to underperform was high inflation in the first place. The transmission channels how high inflation feeds into equities underperformance are numerous. First, high inflation propels wage hikes and makes exporters uncompetitive. Second, high inflation irritates central bankers who in turn have to tighten monetary policy. Higher interest rates and less money in the economy will cause revenues slow down. Third, companies may not have enough pricing power to carry higher input costs into prices of finished products. There are other channels such as less money (read less oil in the economy gear seat) will expose all the frauds and badly managed companies relying on cheap interest. We had such an example in Indian microfinance companies or Reliance conglomerate.
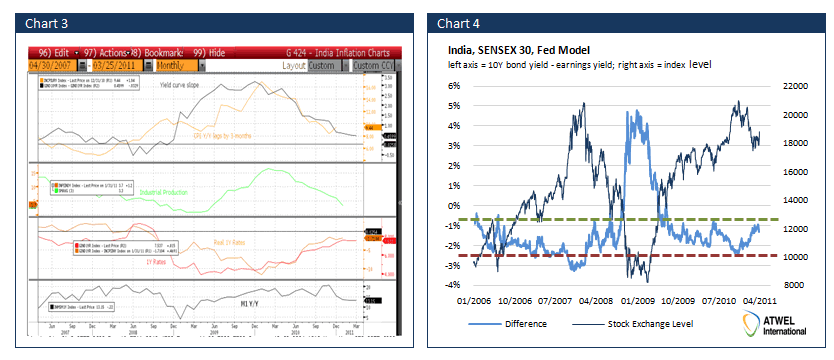
Today, Indian inflation measured as CPI dropped from 16% y/y to about 9% y/y. We all know that due to Balassa-Samuelson effect, low income nations tend to experience higher inflation. But is 9% high or low? And where is the inflation heading?

From the Chart 2, we can see that Indian inflation depicted in red dot is a notch or two too high and equilibrium inflation would stand around 5-6%. As we wrote in earlier publications, the main reason for high Indian inflation is the quantity and quality of infrastructure. But the central bank cannot let inflation run loose otherwise it would lose credibility. And we think the recent tightening in India and across Asia will be sufficient to bring inflation down in the second half of year. As you can see, slope of Indian yield curve is close to reverting, real 1Y rates are getting slowly to positive territory and M1 growth is decelerating. All this points to lower inflation across rest of 2011 (see Chart 3).
As the inflation may get exhausted and there will be little need for 10Y bonds to rise, Indian stock market are starting to flash green buy signal on us. See the Sensex Fed model which is based on difference between earnings yield and 10Y bond yields. You can easily speculate on India via ETF:PIN or SCIF.

Analyst with ATWEL International Hedge fund
© 2011 Copyright Jan Kaska, - All Rights Reserved
Disclaimer: The above is a matter of opinion provided for general information purposes only and is not intended as investment advice. Information and analysis above are derived from sources and utilising methods believed to be reliable, but we cannot accept responsibility for any losses you may incur as a result of this analysis. Individuals should consult with their personal financial advisors.
© 2005-2022 http://www.MarketOracle.co.uk - The Market Oracle is a FREE Daily Financial Markets Analysis & Forecasting online publication.


