Gold No Breakout So Far, Silver Hits Strong Resistance
Commodities / Gold and Silver 2011 Mar 26, 2011 - 02:32 AM GMT There are so many news items affecting precious metals, especially gold, these days. The precious metals glittered in their roles as havens as euro-zone debt worries resurfaced increasing the anxiety among market participants already jittery about $106 oil, the fighting in Libya, protestors killed in Syria and the nuclear crisis in Japan.
What is the market scenario in precious metals at this juncture? Investors clamoring for safe places to stash their money sent gold futures to a record high and silver to a fresh 31-year peak. Prices turbocharged as gold futures overcame a weak start to soar past $1,440 an ounce, well on their way to setting a settlement record high.
With so much taking place in the world, let’s turn to the technical portion of this essay. This week we provide you with gold, silver and platinum charts. We will start with the long-term chart for gold (charts courtesy by http://stockcharts.com.)

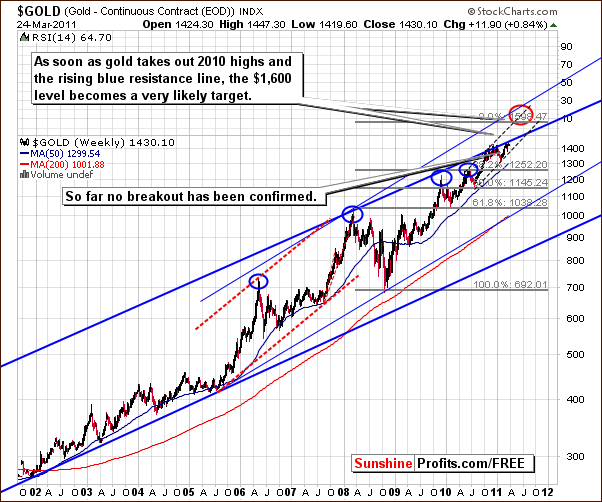
Gold has been struggling to move above the rising trend channel. No breakout has yet been confirmed above either the upper border of the trading channel or the 2010 highs. Only after these levels are taken out is a move towards the $1,600 target level likely to begin. Also, we can see that gold has corrected to its previous support line and the move above it appears to have been verified. RSI levels are no longer overbought as had been the case several weeks ago.
With the lack of recent price action excitement, it seems that there is plenty of capital still on the sidelines. This also makes an upcoming breakout quite possible. However, since a breakout above previous highs has not been seen yet, caution seems to be required in the days ahead.
While gold market is awaiting a breakdown, what is happening in silver market?

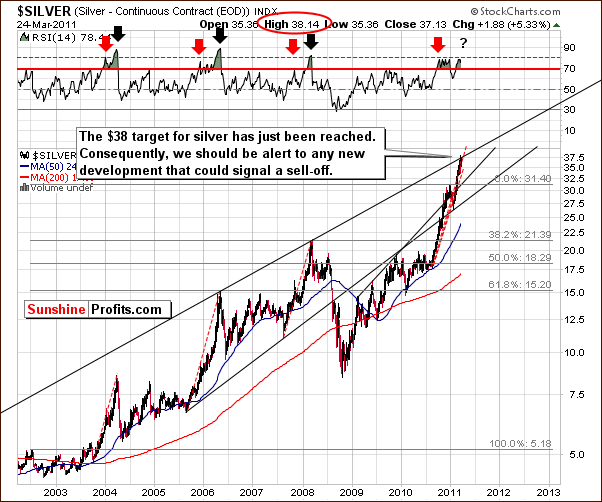
As in gold, long-term silver chart also suggests caution. In silver’s case however, there is another important factor/level which must be considered and that is the long-term resistance line.
As we’ve mentioned in one of our previous essays dedicated to gold & silver analysis, the $38 level is/was a valid target level for this rally and thus it’s likely to provide strong resistance, when it’s reached. This is what we have just seen.
Please note that $38 is the price that is right at the long-term resistance line created based on the highs seen in 2006 and 2008. These are two of the three most important tops in this bull market, so the resistance level is very important.
Similar situations in the past lead us to realize that if a decline is to be seen soon, then it is likely to be sharp. The recent rally has been much in tune with previous rallies. Only the strong rally seen in 2005 to 2006 was bigger. Although an upside move is possible from here, it might be the case that the top is just around the corner.
Overall, silver has recently seen new highs but a very important resistance level has been reached. All in all, this means that the current situation is very tense and caution is required.
Moving on, let’s take a look at the short-term chart for platinum.

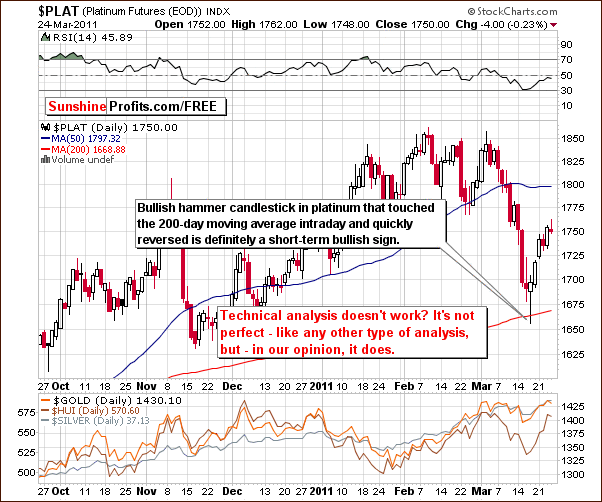
While it does not have important implications for the following days, this chart is being included to clearly show the benefit that technical analysis can provide. Long–term readers of Sunshine Profit’s publications are confident in the validity of technical analysis but many opposing views are often seen in the financial pages.
This chart is a perfect example of an important and valuable technical signal (actually combination of two of them). The “bullish hammer candlestick” pattern touched the 200-day moving average and prices have immediately reversed. More importantly, other precious metals then followed. This clearly refutes the claims of those opposed to technical analysis as being useless. While it’s true that it is not perfect (no way to approach the market is), it works quite often and gives both positive and negative signals in advance of important market moves. Without it, Investors and Speculators simply cannot have the complete overview of the markets.
Amid the uncertainties associates with precious metals market, let’s have a look into the gold seasonality.
http://www.sunshineprofits.com/premium_commentary/18-febIn our Premium Update posted on February 18th, we argued based on our forthcoming tool – True Seasonals (which – unlike other similar tools available on the Internet - presents seasonal price patterns adjusted for the expiration of derivatives and provides you with information about this projection’s quality) that the price of gold might decline in the second week of March. True Seasonals indicated a possible decline on March 8th and pointed to March 17th as to a possible end of the bumpy period. As a matter of fact gold did decline on March 9th and regained its momentum precisely on March 17th.
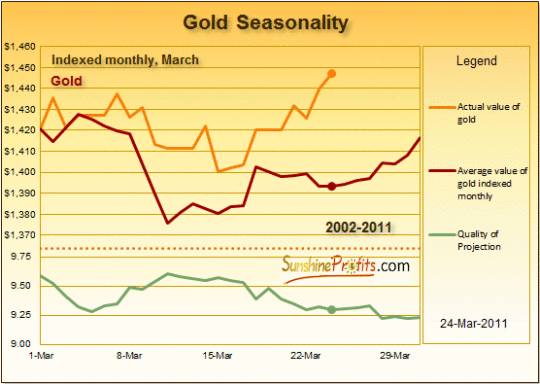
However, on February 18th, we did not know what the price of gold would be on March 1st and we assumed that it would be $1379 (the latest available price at the moment – form February 17th). Today the situation is different – we know what the price was on March 1st. Below you will find a comparison of the prices predicted by True Seasonals on March 1st and the actual prices of gold in March (up to March 24th).
Let’s take a look below to see what these (so far reliable) tendencies suggest for the end of the month.

The red line shows prices of gold that True Seasonals had predicted. The orange line presents the actual prices of gold in March. As we can see the actual prices of gold followed closely these forecasts. What is most important is the fact that the actual direction of price changes remained in line with the direction predicted by True Seasonals. All of this makes the seasonal analysis even more interesting for you at the moment.
At this moment the above chart suggests that the price might have gone a bit too high on a short-term basis, as it is visibly above what the tool would suggest. Still, the quality of projection is not too high at the moment and will decrease until the end of the month. Consequently, caution is necessary, especially if you are currently betting on higher values of gold. If you’re interested in viewing the True Seasonal chart for April, we encourage you to subscribe – this chart has been included in today’s Premium Update.
At this point we feel obliged to remind you – factors other than seasonality and expiration of derivatives might influence the prices of precious metals. Because of that, we strongly recommend you to keep track of the situation on the market and utilize other tools as well.
Summing up, the situation in metals is quite extreme at this moment. Silver moved to new highs but encountered a very long-term resistance level. Gold moved higher but failed to confirm the breakout above the previous highs. Given this level of uncertainty, it might be best of one to wait for additional (either bearish or bullish) signals before entering any speculative transactions in the precious metals sector.
To make sure that you are notified once the new features are implemented, and get immediate access to my free thoughts on the market, including information not available publicly, I urge you to sign up for my free e-mail list. Sign up today and you'll also get free, 7-day access to the Premium Sections on my website, including valuable tools and charts dedicated to serious PM Investors and Speculators. It's free and you may unsubscribe at any time.
Thank you for reading. Have a great and profitable week!
P. Radomski
Editor
Sunshine Profits
Interested in increasing your profits in the PM sector? Want to know which stocks to buy? Would you like to improve your risk/reward ratio?
Sunshine Profits provides professional support for precious metals Investors and Traders.
Apart from weekly Premium Updates and quick Market Alerts, members of the Sunshine Profits’ Premium Service gain access to Charts, Tools and Key Principles sections. Click the following link to find out how many benefits this means to you. Naturally, you may browse the sample version and easily sing-up for a free trial to see if the Premium Service meets your expectations.
All essays, research and information found above represent analyses and opinions of Mr. Radomski and Sunshine Profits' associates only. As such, it may prove wrong and be a subject to change without notice. Opinions and analyses were based on data available to authors of respective essays at the time of writing. Although the information provided above is based on careful research and sources that are believed to be accurate, Mr. Radomski and his associates do not guarantee the accuracy or thoroughness of the data or information reported. The opinions published above belong to Mr. Radomski or respective associates and are neither an offer nor a recommendation to purchase or sell securities. Mr. Radomski is not a Registered Securities Advisor. Mr. Radomski does not recommend services, products, business or investment in any company mentioned in any of his essays or reports. Materials published above have been prepared for your private use and their sole purpose is to educate readers about various investments.
By reading Mr. Radomski's essays or reports you fully agree that he will not be held responsible or liable for any decisions you make regarding any information provided in these essays or reports. Investing, trading and speculation in any financial markets may involve high risk of loss. We strongly advise that you consult a certified investment advisor and we encourage you to do your own research before making any investment decision. Mr. Radomski, Sunshine Profits' employees and affiliates as well as members of their families may have a short or long position in any securities, including those mentioned in any of the reports or essays, and may make additional purchases and/or sales of those securities without notice.
Przemyslaw Radomski Archive |
© 2005-2022 http://www.MarketOracle.co.uk - The Market Oracle is a FREE Daily Financial Markets Analysis & Forecasting online publication.


