


World Non-Energy Commodity Price BubbleOmiX: Crash Warning
Commodities / CRB Index Mar 25, 2011 - 12:09 PM GMTBy: Andrew_Butter

 There is a pretty little chart doing the rounds, put up originally by the Netherlands Bureau for Economic policy Analysis; that has been seized on by the Fed and her acolytes to prove that “easy-money” from that source did NOT cause a bubble in commodity prices, or perversely, by the Fed-Bashers to prove the opposite.
There is another way to look at that chart.
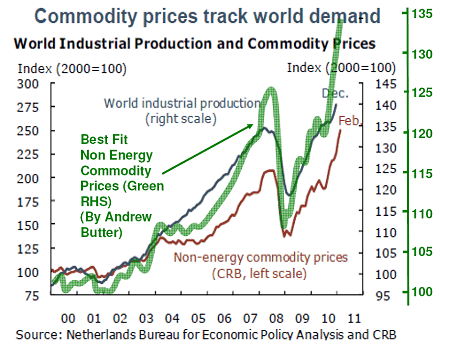
I know that economists like to think of themselves as artists rather than scientists (or perhaps “artiste’s), but the way I got taught the “science” of the quasi-science of statistics (as in Rutherford’s comment, “if you need statistics to prove your case you should have done a better experiment”), first you do a single line regression, next you establish the “best-fit”, and then you do a “t” test. But “artiste’s” they just go with the pretty colours and pontificate.
Do it that way and you get the green line which is the best fit of price as a function of industrial production (of course correlation doesn’t prove cause, but at 85% R-squared, (a) it’s worth a second glance, and (b) the other option is to think about is whether the two variables are independent but are both driven by something else).
If either (a) or (b) are correct (the other option is that it’s just random, and the chances of that being right from the data on the chart are 100:1 against), then this is the story:
1: Early 2008 there was a mild bubble (5% or so) which popped (thanks also to the collapse of industrial production near the end of 2008.
2: There was an overshoot in early 2009 (perfectly normal).
3: Thereafter price tracked the “fundamental” until early 2011.
4: Now there is a moderate bubble (135/122 = 10%).
Interestingly 10% to 15% is about the level of over-pricing that this analyst thinks oil is at right now:
http://www.marketoracle.co.uk/Article24849.html
So next, either the bubble will keep building (even more fun for the shorts when the pop comes, if they get it right), or there will be a pop soon.
If the pop is sooner rather than later, expect the Non-Energy Commodity Index to go down to 115 or so.
By Andrew Butter
Twenty years doing market analysis and valuations for investors in the Middle East, USA, and Europe; currently writing a book about BubbleOmics. Andrew Butter is managing partner of ABMC, an investment advisory firm, based in Dubai ( hbutter@eim.ae ), that he setup in 1999, and is has been involved advising on large scale real estate investments, mainly in Dubai.
© 2011 Copyright Andrew Butter- All Rights Reserved
Disclaimer: The above is a matter of opinion provided for general information purposes only and is not intended as investment advice. Information and analysis above are derived from sources and utilising methods believed to be reliable, but we cannot accept responsibility for any losses you may incur as a result of this analysis. Individuals should consult with their personal financial advisors.
Andrew Butter Archive |
© 2005-2022 http://www.MarketOracle.co.uk - The Market Oracle is a FREE Daily Financial Markets Analysis & Forecasting online publication.
Comments
|
Rich
09 Oct 11, 12:31 |
cpi
Non-energy commodity price index is dropping, as you predicted. In a few more months we will see if bottom prediction was accurate. |