


Stock Market Hangs in the Balance Whilst Social Mood Deteriorates Further
Stock-Markets / Stock Markets 2011 Mar 24, 2011 - 04:19 AM GMTBy: J_W_Jones

 “We crawl on our knees for you,
Under a sky no longer blue
We sweat all day long for you,
But we sow the seeds to see us through
‘Cause sometimes dreams just don’t come true,
Look now at what they’ve done to you.” -Rise Against: Re-Education (Through Labor)
Before getting into the broader markets, I thought it was pertinent to share with readers that recently I have noticed a trend in alternative music, also known as modern rock. As a fan of music in general, I have noticed that more modern and mainstream music is starting to underscore the deterioration in social mood. Mainstream songs are having a resoundingly similar lyrical undertone which outlines the “us against them”, “rich versus poor”, and the political class versus everyone else.
While I am not a sociologist nor do I have any real training in the area, the underlying tone in a lot of artistic mediums highlights the current chasm between the haves and the have-nots. While some might argue that it does not matter, if you as a reader, trader, or investor believe in behavioral finance you might agree that social mood matters a great deal. After all, the entire premise of technical analysis is an attempt to quantify market participant behavior at specific price levels.
Social mood is but one catalyst that can have a dramatic impact in price discovery, and thus must at the very least be monitored. Current music trends are literally screaming loud and clear that the average American can relate to the undertones and messages of song lyrics with the same resounding tone as the Rise Against lyrics listed above. Believe me, it may not matter right now, but it will matter and when it does it will likely be too late for financial markets.
Now that I have my little rant out of the way, why don’t we take a look at where the S&P 500 has been, where it is now, and where it might be going. Currently price action in the S&P 500 is sitting on the edge of a fence. We could be looking at an intermediate bottom or it could end up being a bull trap. As for me, my recent prediction for lower prices has indeed come to pass, but from hereon I have no real idea where price action is headed. Mr. Market is leaving a few clues behind which I will outline, but anything is possible. We have seen stocks climb a wall of worry for nearly two years now so there is precedent for a rally from this current point of indecision.
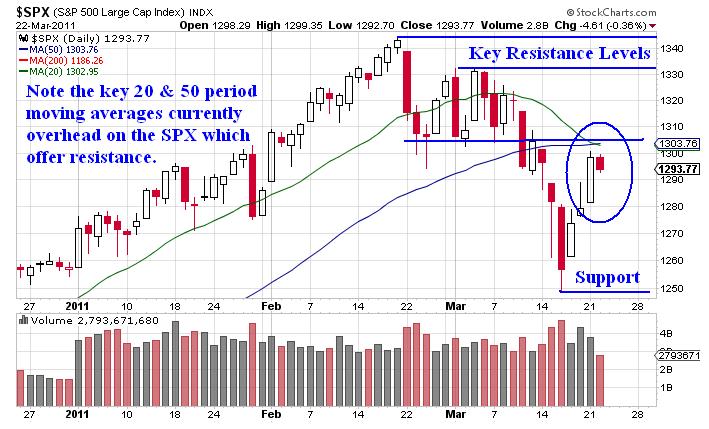
The daily chart of the S&P 500 listed below illustrates key technical levels on the daily chart, however readers will notice that we are currently caught between a ton of overhead resistance and a key support level. Until we see price move in either direction with volume confirmation, I will be sitting on the sidelines.
Another key chart to consider is the SPX weekly chart. A quick glance at the slow stochastic readings at the bottom of the chart reveal that the S&P 500 might have additional downside left before the market is able to form a solid bottom. If that is true, we could see the SPX test the 200 period moving average on the daily chart which would be around the 1186 price level. Additionally, the 50 & 200 period moving averages on the weekly chart correspond with the 1180 price level which is likely not coincidental. The level also corresponds with key resistance areas going back to the November 2010 lows. While a downward move that large seems a bit extreme to me at this point, anything is possible.
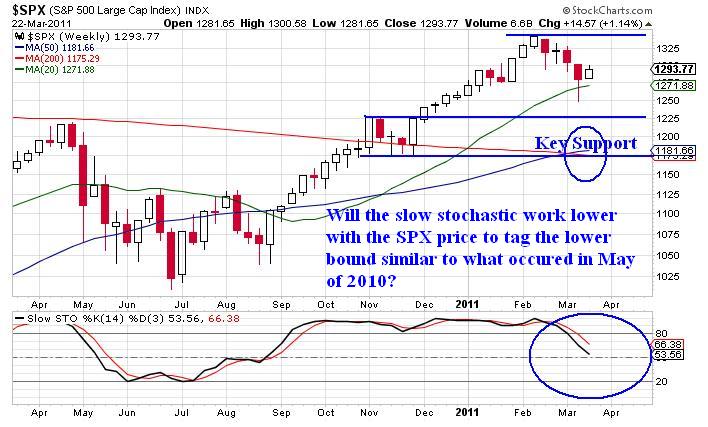
As can be seen from the chart above, price action is currently sitting above the 20 period moving average on the weekly SPX chart. Key support levels are around the 1225 and 1180 price levels. I would also point out that a Fibonacci retracement of the recent pivot high to the recent pivot low gives us a possible 1.618 retracement around the 1190 price level. Additionally, the slow stochastic on the chart above is eerily similar to levels that were seen on the weekly chart back in May of 2010. Will price action work lower? Will the weekly slow stochastic reading kiss the 20 level?
At this point, a few of you might think I’m outlining the case for lower prices in the equity market. I honestly have no idea where price is going from here, I’m just outlining some key aspects that I have found in my analysis to the downside. The upside is just as likely and we could see the SPX price bounce off of the 20 period moving average on the weekly chart and a challenge of the recent highs could play out. Should recent highs give way to breakout, the SPX would likely test the 1,400 price level at some point in the future.
If we look at the VIX for any clues, all that can be seen from that chart is a spike higher and a subsequent selloff as fear and uncertainty leave the marketplace. The VIX is currently arguing for higher prices in equities, however the financials represented by XLF are the fly in the proverbial ointment. The banks were unable to attract a bid on Monday’s strong advance and they experienced additional selling pressure on Tuesday. In fact, the XLF’s daily chart shown below reveals a key test and subsequent failure.
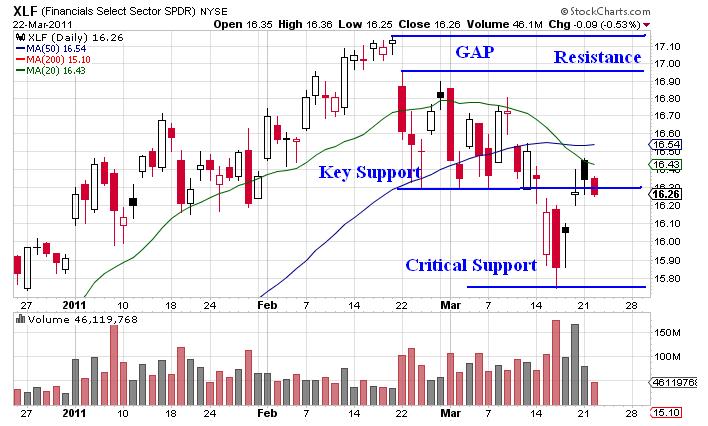
A quick look at the XLF daily chart and it is rather obvious that price action in XLF has been weak in the past two sessions. Price moved higher off of the recent lows, tested the 20 period moving average and rolled over. Price is currently below key support levels, but we could witness a reversal on Wednesday. I am going to be watching the financials (XLF) quite closely in coming days as I believe the banks will provide traders with clues as to which direction Mr. Market is favoring. Right now it would appear that Mr. Market is favoring lower prices, but that would seem a bit too easy from these eyes.
We could consolidate at these price levels for a period of time. The volume on Monday and Tuesday was light and we have non-confirming signals showing up in a variety of underlying indices. I am unwilling to accept any directional risk at this point. I will let others do the heavy lifting while I sit safely in cash and watch the price action play out.
The price action will eventually give us a confirming signal as to which direction prices will be heading, but right now I believe the prudent thing to do is remain in cash and wait for Mr. Market to signal which direction he favors. We are either sitting at the beginning of a major move higher or we are at a precipice and prices are about to plunge. Either way, risk remains high and the risk / reward is simply not there to warrant an entry. As I have said many times, sometimes the best trade is no trade at all!
Get My Trade Ideas Here: http://www.optionstradingsignals.com/profitable-options-solutions.php
J.W. Jones is an independent options trader using multiple forms of analysis to guide his option trading strategies. Jones has an extensive background in portfolio analysis and analytics as well as risk analysis. J.W. strives to reach traders that are missing opportunities trading options and commits to writing content which is not only educational, but entertaining as well. Regular readers will develop the knowledge and skills to trade options competently over time. Jones focuses on writing spreads in situations where risk is clearly defined and high potential returns can be realized.
This article is intended solely for information purposes. The opinions are those of the author only. Please conduct further research and consult your financial advisor before making any investment/trading decision. No responsibility can be accepted for losses that may result as a consequence of trading on the basis of this analysis.
© 2005-2022 http://www.MarketOracle.co.uk - The Market Oracle is a FREE Daily Financial Markets Analysis & Forecasting online publication.