Dow Jones Stock Market Cycle Analysis - Trend Still Up, Still Positive, But Caution is Advised
Stock-Markets / Cycles Analysis Jan 28, 2007 - 04:30 PM GMTBy: Tim_Wood
The positive for the market is obviously that it continues to move higher and higher as the advance out of the June/July lows remains intact. According to Dow theory, the Secondary Trend also remains intact and as I read the Dow theory I also believe that the Primary Trend is also positive. Cyclically, the longer-term trend remains positive as well. So, let me make it clear that until a confirmed downturn according to Dow theory and/or a cyclical breakdown of at least intermediate degree occurs, this advance cannot be called done.
Now, I want to talk about a few of the problems and reasons for concern about the ongoing advance. First and contrary to popular opinion, the long-term data continues to suggest that the 4-year cycle low is still ahead of us. I am totally aware of the fact that most people are of the opinion that the 4-year cycle low occurred at the June/July 2006 lows. The problem with such opinion is that it is a convenient answer and not based on any of the historical “DNA” markers that have occurred at other 4-year cycles in over one-hundred years of market data. By saying this I am not trying to fight the trend, because again I agree that as of this writing the trend is still up in accordance with both the Dow theory and my cyclical based work.
What I am saying here is that the 110 years of market data available on the Industrials continues to suggest that this advance is carrying the market into the 4-year cycle top rather than the move out of the summer lows being the 4-year cycle low, as most of the rest of the world believes. The full details and ongoing developments surrounding this opinion are far beyond the scope of this brief article.
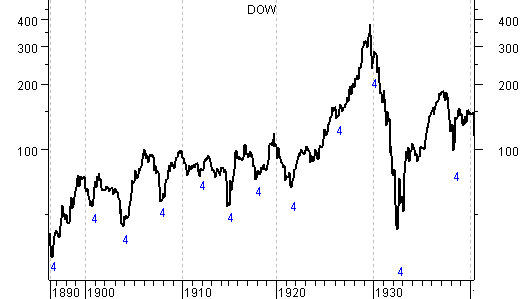
Below, I have included a chart of the Industrials from their inception in 1896 to 1940. I have marked each of the 4-year cycle lows with a blue number “4”.
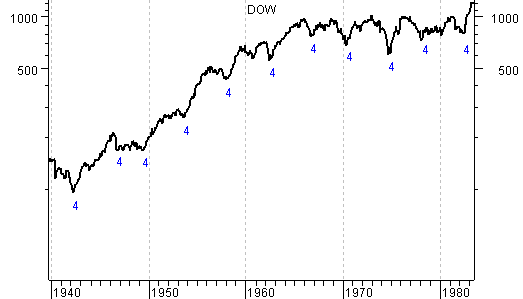
In the next chart below we have the Industrials from 1940 into the 1982 4-year cycle low and again you can clearly see the ebb and flow of this cycle.
Lastly, we have a chart of the Industrials showing the 4-year cycles from 1982 to present. Again, you can see the ebb and flow of the 4-year cycle. It is true that the declines into 1990 and particularly the decline into 1994 were modest. However, those declines still measured up to the historical “DNA” markers that have been present at all previous 4-year cycle lows since 1896.
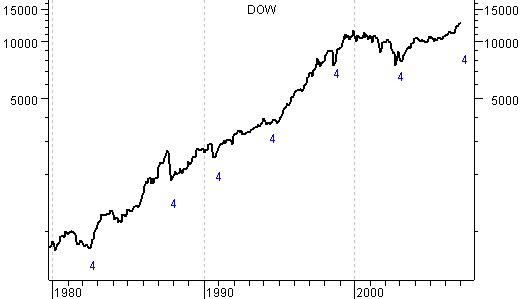
To the contrary, the decline into the summer lows of 2006 did not meet any of the historical “DNA” markers that have been present at all of the previous 27 4-year cycle lows since 1896. Sure, the market can do anything and there is a first time for everything. But, at present there still is no hardcore supportive data that the 4-year cycle low occurred last summer. As a result, the odds simply suggest that this advance is still pushing up into the 4-year cycle top and that the low still lies ahead. I know this may be hard to believe, but this conclusion is not some shallow opinion. My opinion is based on substantial quantitative analysis.
Think of it like a blood test from the doctor. Just because you don't feel bad isn't justification that his lab work is invalid. By the same token, just because the rest of the world believes that the summer low marked the 4-year cycle low and the market has continued to hold does not mean that they are correct. I can promise you, they don't have the statistical quantification surrounding the 4-year cycle that I have.
Next, I want to talk about the Dow theory piece of the equation and first let me say that cycles are not a part of Dow theory. But, it is an historical fact that the vast majority of all 4-year cycle tops have also occurred in conjunction with a Dow theory non-confirmation. Such non-confirmation is marked in red and can be seen in red on the chart below as the market moved into the 2000 top. The current non-confirmation is noted in green and has been ongoing since May 2006.
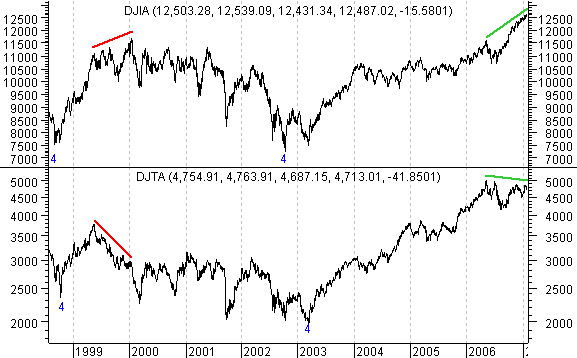
I have said this before, but let me say it again. Non-confirmations are not buy and sell signals. Rather, they are warnings that a possible trend change is in the making. So, as long as this non-confirmation is in place, it must be respected as the warning that it is.
In spite of the Dow theory non-confirmation and the statistical quantifications surrounding the 4-year cycle the public remains very bullish and completely oblivious to the current market risk. One measure of this sentiment comes from the Investor Intelligence data. Below is a weekly chart of the Industrials along with the weekly Investor Intelligence readings in the upper window. We have just completed the 223 rd consecutive week with this reading either at or above the 50% level. When this indicator is at the 50% level it means that there are just as many bulls as there are bears. When this indicator is at 75% it is telling us that there are 3 times as many bulls as there are bears.
The point here is that optimism among investors ebbs and flows with market cycles. For example, since the inception of the Investors Intelligence data every 4-year cycle low has occurred with extreme pessimism. All the while, 4-year cycle tops are made with extreme bullishness and optimism. So, it is a fact that most people are the most bullish at or near a top and that most people are the most bearish at or near a bottom. Please understand that just as with non-confirmations sentiment data does not yield buy and sell signals, but rather serve as an indication of the overall mood of the market place. Let me also add that since the inception of the Investors Intelligence data back in the 1960's there has never been a period of such persistent bullishness. Even during the bull market of the 1990's and into the 2000 top this level of consistent bullishness was not seen. At 223 consecutive weeks at 50% or more we are indeed at record bullish levels. What this amounts to is that this entire 4-year cycle advance has occurred with the plurality of bulls over bears and that has never occurred before.
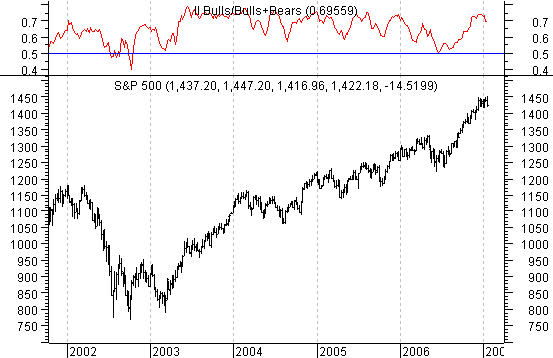
One danger here is that the statistical data continues to warn that we are moving into the 4-year cycle top and we also still have a Dow theory non-confirmation that has yet to be corrected. At the same time, we also have far too many people on the optimistic side of the boat as is evident by the sentiment data. If the Dow theory non-confirmation is not corrected and if the statistical data surrounding the 4-year cycle is correct this time around, then when sentiment begins to shift, there is going to be an awful lot of people running to the other side of the boat. Point being, we do have considerable market risk in spite of the fact that we still have a positive trend and if the cattle were to spook, things could/should get very interesting very quickly.
By Tim Wood
Cyclesman.com
Tim Wood specialises in Dow Theory and Cycles Analysis. To get the technical and statistical facts and know when significant turns come based on the ever so important Cycle Turn Indicator Visit www.cyclesman.com/testimonials.htm.
Should you be interested in very detailed and solid factual quantitative analysis on the 4-year cycle, then you should consider Cycles News & Views. Such analysis and on going developments are far beyond the scope of these brief articles. Please also understand that I simply cannot make these details available to the general public. I cover not only the stock market but, the dollar, gold and bonds. I also report on other key markets such as oil, gasoline and copper at important turn points using my Cycle Turn Indicator and updates three times a week. A more recent call by the Cycle Turn Indicator was the down turn out of the December counter trend bounce in oil and then the low that was made just last week. If I could only have one indicator, it would be the Cycle Turn Indicator. Get the technical and statistical facts and know when significant turns come based on the ever so important Cycle Turn Indicator.
© 2005-2022 http://www.MarketOracle.co.uk - The Market Oracle is a FREE Daily Financial Markets Analysis & Forecasting online publication.


