Key Market Trends between QE1 and QE2
Stock-Markets / Quantitative Easing Mar 19, 2011 - 10:49 AM GMTBy: Asha_Bangalore
 The Fed's latest policy statement suggested that it is most likely to complete the second round of quantitative easing (QE2) by June 2011. Discussions are underway about the status of financial markets after the termination of QE2 and if additional support will be necessary for self-sustained economic growth. In the interim, it is informative to trace the behavior of markets when QE1 was completed and QE2 was not in place. Chairman Bernanke's August 2010 speech laid the foundation for expectations of QE2.
QE1 involved the purchases of $300 billion of Treasury securities, $1.25 trillion of mortgage backed securities and $175 billion of agency bonds and was in place between December 2008 and March 2010. The U.S. economy had registered three quarters of economic growth by the end of the QE1 program but the unemployment rate in March 2010 stood at 9.7%, which is small decline from a high of 10.1% in October 2009. The jobless rate failed to register a meaningful drop until later in 2010 and more so by January-February 2011. The elevated unemployment rate was a large part of the reason for QE2. In addition, inflation readings were below levels consistent with price stability, another factor justifying QE2 (see Chart 2).


Equity prices in the United States moved up when QE1 was in place and posted a setback in 2010 when the European debt crisis unfolded in the first-half of 2010 and triggered a small correction. But, equity prices turned around and volatility declined (see Chart 3) many months prior to the inception of QE2 and when QE1 has expired.

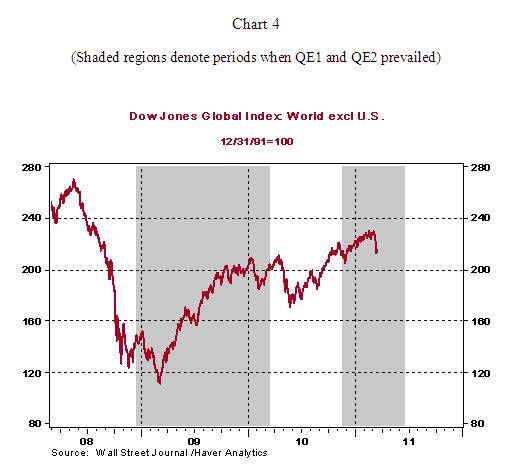
The debt crisis in Europe played a role in the behavior of equity markets across the world. Equity prices fell for a short period but recovered as the Euro-zone problems where addressed (see Chart 4).

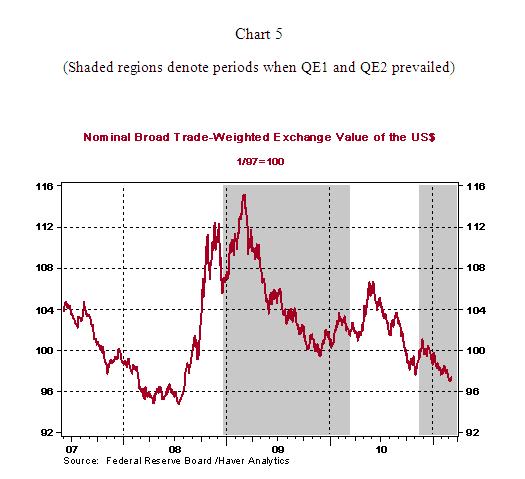
With the exception of the flight to safety during the early months of QE1 in 2009 and the European debt crisis phase in early-2010, the dollar has lost ground. Essentially, the movement of the dollar reflects market assessment of fundamentals germane to the dollar.

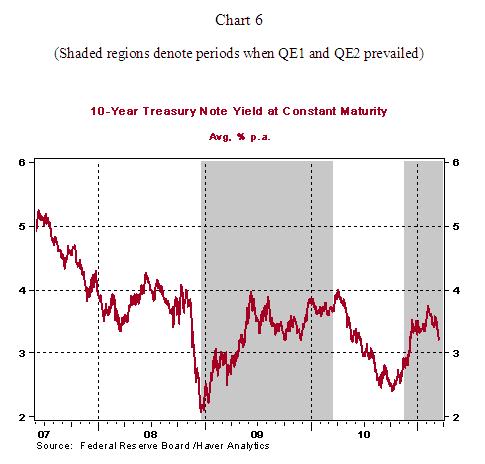
In the bond market, the 10-year U.S. Treasury note yield rose as support from QE1 revived economic activity. The debt crisis in Europe and the soft tone of economic data led to a rally in the bond market during the period when QE1 had expired and QE2 was not in place.

What can one take away from these charts? First, QE1 provided support to the U.S. economy and revived economic activity. Second, in the months before QE2 was put in place, a turnaround of the U.S. economy from a severe recession was a vote of confidence which lifted equity prices. Third, if economic reports in the months ahead plant seeds of doubt about the durability of economic growth, equity prices are most likely to post declines and a drop in interest rates is possible, irrespective of whether QE2 has expired.
Asha Bangalore — Senior Vice President and Economist
http://www.northerntrust.com
Asha Bangalore is Vice President and Economist at The Northern Trust Company, Chicago. Prior to joining the bank in 1994, she was Consultant to savings and loan institutions and commercial banks at Financial & Economic Strategies Corporation, Chicago.
Copyright © 2011 Asha Bangalore
The opinions expressed herein are those of the author and do not necessarily represent the views of The Northern Trust Company. The Northern Trust Company does not warrant the accuracy or completeness of information contained herein, such information is subject to change and is not intended to influence your investment decisions.
© 2005-2022 http://www.MarketOracle.co.uk - The Market Oracle is a FREE Daily Financial Markets Analysis & Forecasting online publication.


