


Stock Market Indices Buying Opportunity
Stock-Markets / Stock Markets 2011 Mar 18, 2011 - 07:37 AM GMTBy: John_Hampson

 In my analysis of February 17th I suggested that a stock market pullback was imminent - it began on the 18th and remains in progress.
In my analysis of March 2nd I suggested the correction should last an average of 4 weeks based on cycles and previous corrections, and that the overly bullish indicators and sentiment needed resetting, in order for the cyclical bull to continue.
In my analysis of March 4th, I pointed to the large triangles in certain Eastern stock indices and suggested a large move was coming with their conclusion, since which the Nikkei and ASX have broken down.
In my analysis of March 11th, I suggested that indicators and sentiment measures had not been yet sufficiently reset and that movement in other asset classes suggested the correction was not yet complete.
In today's analysis, with the correction now 4 weeks old, various indicators and measures are suggesting that a US and European stock indices buying opportunity lies here and in the near term future.
Consider the items below, that point to either a low reached yesterday or a low close ahead:
1. Yesterday, the German Dax index hit daily RSI of 16, a lower reading than that reached in all of the 2007-9 bear. US and other European indices reached 30 or below.
2. Quantitative Edge's proprietary capitulative breadth indicator closed at 8 - readings over 7 have historically implied bear move exhaustion.
3. AAII's sentiment survey for week ending 16th March revealed a jump to 40.1% bears - readings of 46.3% bears or more have historically resulted in a rally for the months ahead - so close but not quite there.
4. The SP500 percentage of stocks above the 50 day moving average achieved a level historically suggestive of a reversal as of now or a little lower:
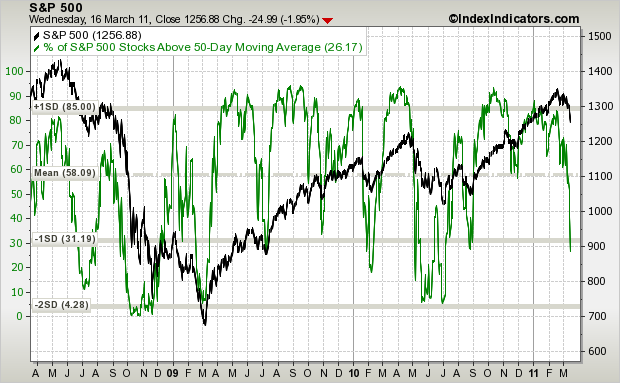
Source: Indexindicators
5. Nymo reached oversold. Typically we see a positive divergence on Nymo lead a reversal in the index. So it may mean we need to see a lower low in the index ahead, together with a higher Nymo reading, before the a reversal in the SP500 comes to fruition.
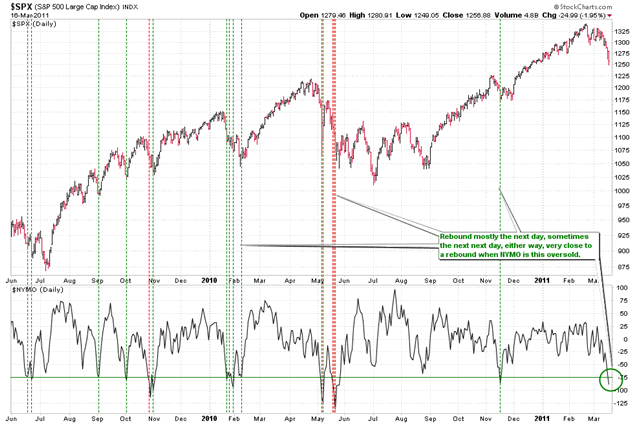
Source: Cobras Market View
6. The Nasdaq Oscillator also reached the oversold level.
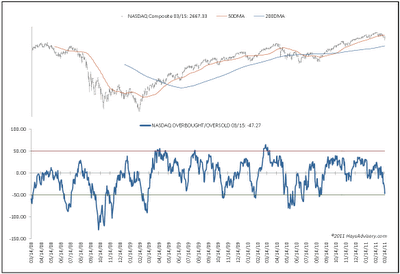
Source: Hays Advisory
In summary, I have sufficient evidence to buy the stock indices here and phase in over the near term should prices track yet lower.
But buy just for a bounce, or for a sustained bull move?
Recall the reasons for the cyclical bull to continue:
1. QE/Pomo ongoing until June, plus Bank of Japan has so far injected $700 billion additional liquidity.
2. ECRI leading indicators are positive and trending up.
3. Money supply growing, money velocity stable.
4. Last earnings season delivered a solid beat rate both in earnings and revenues (higher than the last 3 quarters), and US earnings season begins again April 11th.
5. Stocks are cheap relative to bonds historically.
6. Stocks are in the presidential cycle sweetspot in 2011, particularly the first 6 months.
7. Inflation has not reached over 4%, a historical marker of the end of cyclical bulls.
8. 10 year treasury yields have not reached over 6%, also a historical marker for the end of cyclical bulls.
9. We have not seen a typical stock market topping process, normally lasting several months, accompanied by weakening breadth.
10. Yield curve is normal.
11. We have not reached overtightening of interest rates (not even started), typically ending historical cyclical bulls.
12. Recession models not forecasting a recession in the near future.
13. Solar cycles predict inflation and growth into 2013, then a recession.
14. Previous cyclical bull market internal comparisons predict this cyclical bull to continue until 2013.
And one current warning flag:
15. Bloomberg Financial conditions index has now turned negative.
In summary, the weight of evidence lies firmly with the cyclical bull continuation at the moment, and as previously noted, if this WERE a cyclical bull market top then we should see a range bound 'confused' market, a topping process lasting on average a couple of months or more, whilst stock market internals and the evironment for stocks weakens. It will become clear with time. Therefore, I am buying on the long side expecting cyclical bull continuation, but can sell into the range if a market topping process becomes more evident. The probability of the market having already begun a new cyclical bear from the February 18 peak and continuing downwards does not fit with historical cyclical bull tops and would occur in the face of the 14 counter-reasons listed above. Therefore, the lower the market falls in the near future, the more I want to buy.
The strength of this cyclical bull off the March 2009 low historically suggests this will be a prolonged bull of large returns. In a projected 4 phase cyclical bull our first phase from March 2009 through to April 2010 was amongst the strongest of any in history. The second phase typically produces much more mediocre returns than the first and should last roughly to June 2011. An average 6.4% gain for this second quartile would see the market around 1280 by June. However, given the strength of the bull so far and the supportive role of QE into June, a target of 1350, I believe, is more appropriate.
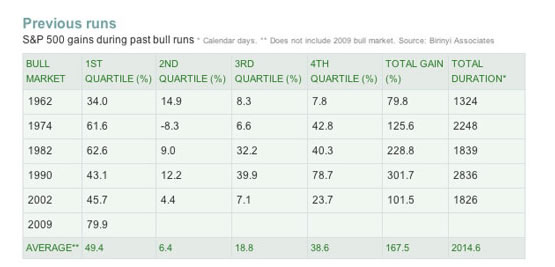
Source: Laszlo Birinyi
The pullback in the markets is welcome as we are now more closely aligned for cyclical bull continuation. To date there has been a good historical rhyme with the cyclical bull of 2003-2007, shown below. A 9-12 month initial steep leg up, a 9 month consolidation or so, and then a cyclical bull continuation but at a shallower rate than the first leg. Our current cyclical bull has thus far been a more supercharged version of 2003 onwards.
There is some downward pressure for the markets into and around this weekend's full moon and some negative seasonality next week. If the markets need to produce a lower low, before rallying, then that makes for a suitable window. April is usually a positive month for stocks.
In summary, the market correction, by time and by indicators, now makes me a buyer both here and in the near term in the eventuality of a lower low, on the basis that the weight of evidence still lies firmly with cyclical bull continuation.
John Hampson
John Hampson, UK / Self-taught full-time trading at the global macro level / Future Studies
www.amalgamator.co.uk / Forecasting By Amalgamation / Site launch 1st Feb 2011
© 2011 Copyright John Hampson - All Rights Reserved
Disclaimer: The above is a matter of opinion provided for general information purposes only and is not intended as investment advice. Information and analysis above are derived from sources and utilising methods believed to be reliable, but we cannot accept responsibility for any losses you may incur as a result of this analysis. Individuals should consult with their personal financial advisors.
© 2005-2022 http://www.MarketOracle.co.uk - The Market Oracle is a FREE Daily Financial Markets Analysis & Forecasting online publication.