


Secular Stock Market Trend Game Changer
Stock-Markets / Stock Markets 2011 Mar 15, 2011 - 05:34 AM GMTBy: John_Mauldin

 This week we look at another except from Ed Easterling’s gonzo book on stock market return projections, called Probable Outcomes. This section is entitled “Game Changer,” and it is that and more. (Again, thanks to Ed for letting us read his work!)
“Game Changer” is a thought-provoking, somewhat detailed analysis, with two major surprises. The first is that GDP growth was well below average last decade (a trend that could continue this decade); and second, slowing growth has a substantial negative effect on valuations (P/E ratios). This ties well into my own Endgame and suggests implications about slower growth, etc. (similar to what I project from work of my own). Slower growth drives P/Es lower (even without higher inflation, or deflation) and could drop the market by a third or so relative to “normal” cycles.
Ed and I talk about this a lot, and agree that readers must understand Endgame to appreciate how significant “Game Changer” can be. Probable Outcomes complements Endgame with specific implications for investors and policy makers who look to the stock market for returns over this decade.
Just another quick plug for Endgame from a review on Amazon:
“Endgame: ‘The final stages of an extended process...’ The aptly chosen title for Mauldin's new book reflects the vision that he started sharing over a decade ago when he foresaw the Muddle Through Economy (he repeatedly warned about Muddle Through in his free weekly newsletter at Thoughts from the Frontline and in his best-selling books).
“In Endgame, Mauldin and Tepper detail the history of events that layered increasing debts on an underperforming economy. Their analysis is not limited to the U.S., but rather walks around the world highlighting a global issue. Mauldin again demonstrates his laudable ability to synthesize vast amounts of information into relevant nuggets. The first half of Endgame lays the foundation brick-by-brick, including a look at the basics of economics and recent research to understand the situation. The second half of the book proceeds country by country laying out the common and unique problems that they confront. It exposes a world of vulnerability, but not one that is hopelessly destined. Mauldin and Tepper are optimists, and present a call to action that can result in a successful endgame.
“Once again, as another decade starts, Mauldin assembles a plethora of data and charts to deliver information that investors, policy makers, and involved citizens need to better understand and act upon. From the classic principles of Minsky to the modern groundbreaking research of Reinhart and Rogoff, Mauldin explains clearly the credible scenario that the burdens from mountains of debt create another decade or longer of Muddle Through as a process rather than an event. Passage through the vestibule of the endgame requires restitution in the forms of deflation, inflation, volatility, and slow economic growth. Despite the headwinds, endgame need not be game-over – which appears to be Mauldin's personal game plan for his new book. He includes writings to his children that their future can be much brighter than the current period that we confront. Knowledge is power and you'll find both in Endgame.”
You can get the book at Amazon or Barnes & Noble. And enjoy "Game Changer"!
Your writing away analyst,
John Mauldin, Editor
Outside the Box
Game Changer
An Excerpt from Probable Outcomes: Secular Stock Market Insights
By Ed Easterling
Copyright 2010, Crestmont Research
Well-recognized and published statistics tell us that the long-term return from the stock market has been 10%. The reality is that the 10% average reflects the combination of periods with above-average returns and those with below-average returns. These periods, however, are not random sets of over and under. Rather, the stock market experiences these periods based upon fundamental conditions in the economy and the financial markets.
Further, the conditions are recognizable, and therefore stock market returns are relatively predictable over extended periods of time. These periods are known as secular stock market cycles. The term “secular” is derived from a Latin word that means an era, age, or extended period. Actually, an original Latin variation of the word has been closer to hand than most people realize.
On the back of the American one-dollar bill is the Great Seal of the United States. One part of the seal is the circle on the left-hand side bearing a pyramid topped with an eye. Look closely under the pyramid: there is a banner with the phrase “novus ordo seclorum.”
In 1782, Charles Thomson, a Founding Father of the United States, and secretary of the Continental Congress, worked as the principal designer of the Great Seal. There is extensive symbolism included in the seal. When Thomson proposed the seal to Congress, he described the meaning of novus ordo seclorum as “the beginning of the new American Era.”
When the word “secular” is used to describe stock market cycles, it expresses that the cycle is an extended period with something in common throughout. Secular bull markets are extended periods that cumulatively deliver above-average returns. These periods are driven by generally rising multiples of valuation as measured by the price/earnings ratio (P/E). Secular bear markets are the opposite: extended periods with cumulative below-average returns driven by a generally declining P/E for the market. Thus the secular aspect of these periods relates to the generally rising or falling trend in P/E over an extended period of time.
P/E is the price of the market divided by the earnings of the market. Investors and analysts often apply to individual stocks the same formula used for the market. This valuation multiple essentially represents the number of years’ worth of earnings that investors will pay for the investment. During certain conditions, typically when the inflation rate is low and interest rates are low, investors are willing to pay higher prices measured as a multiple of earnings for the market and for stocks in general. When inflation and interest rates are high, or when deflation (negative inflation) occurs, investors are driven to pay lower prices and multiples for the market. Probable Outcomes goes deeper into the financial reason for those decisions. At this point, it is important to remember that the stock market moves through periods of above- and below-average returns—known as secular stock market cycles.
The secular cycles are graphically visualized in figure 2.1, reflecting the secular bull market periods (green bars) and secular bear market periods (red bars). The blue line below the bars reflects the cycle of the P/E ratio that drives the green-bar and red-bar periods.
Figure 2.1 Secular Stock Markets Explained
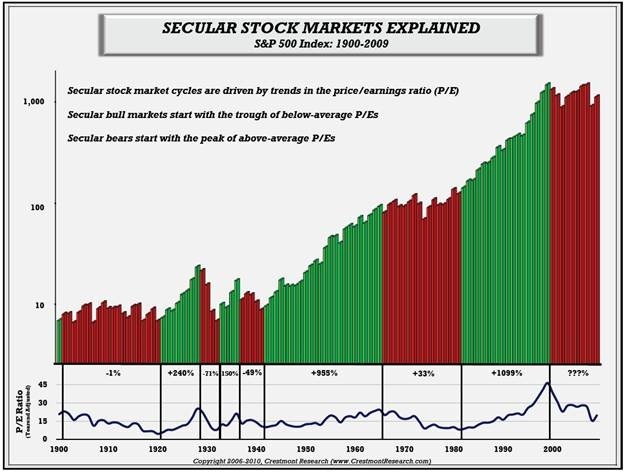
Link: Secular Stock Markets Explained
The most significant aspects to note in this chart include the variability in time over which secular cycles occur. Some cycles were relatively short, while others lasted close to two decades. This graph also begins to gives us a sense that returns come in spurts rather than a more consistent uphill grind around an average that some people incorrectly believe is normal.
In particular, note the blue line on the lower part of figure 2.1, reflecting P/E and its cycle over more than a century. The historical range within which P/E has cycled has been relatively consistent: generally with lows that were near 8 and highs in the low to mid-20s (except, of course, the late 1990s bubble). The historical average has been near 15, depending upon the method and time period used.
Foremost, keep in mind two key points. The range of the P/E cycle, as established by the highs and lows, is largely determined by the real growth rate of earnings. The relative position of P/E within the range is what has been determined by the level of inflation and its trend.
Pop Quiz
Before venturing further into the discussion about the P/E cycle, pause a moment for a pop quiz to highlight the previous point about the effect of economic growth on P/E. There is new information that could actually make it different this time!
Beyond the insights from the question and its answer, this will start the journey toward the potential scenarios for the economy over this decade and the implications for stock market returns.
Over the past century in the United States, real economic growth before inflation has averaged near 3% per year. Over the decades of the 1970s, 1980s, and 1990s, the compounded average annual growth rate was 3.2%, 3.0%, and 3.2% respectively. So during the decade of the 2000s (2000–2009), when consumers were loading up their credit cards, homeowners were said to be using home equity like an ATM, unemployment averaged 5.5% and fell below 4% at times, and leverage was being added to leverage, what was the compounded annual growth rate before inflation rounded to the nearest percent?
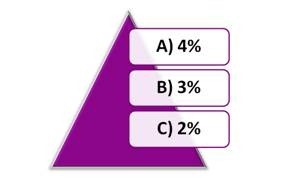
The first choice, 4%, is the most logical response. It reflects the perception that much of the consumption and leverage artificially accelerated economic growth. People that choose 4% expect that the factors in the question boosted economic growth above the historical and recent average growth rate.
Following such a strong period of economic growth, most people answering “A” expect a period of below-average growth over the 2010s to make up for the excesses of the prior decade. They expect that periods during which growth was fueled by debt will be followed by offsetting moderation as the vestiges of leverage and excess consumption are addressed.
The second choice, 3%, is the contrarian response. It reflects a belief that this time was not different. Though some of the factors included in the question may have impacted economic growth, people who choose 3% either don’t believe that those factors had much effect, or presume that there may have been similarly unique factors during prior decades. Nonetheless, economic growth of 3% has endured for more than one hundred years and has been very consistent in recent decades. Some people in this group believe that 3% is likely for this decade, while others have begun to adopt the notion of a New Normal with slowing growth due to recent trends in demographics, government policy, taxes, etc.
The third choice, 2%, is the correct response, despite being least selected. Many investors are surprised that the decade of the 2000s experienced compounded annual growth of only 1.9%. Some economists say that it was a decade sandwiched by two recessions, while others blame it on the severe recession of 2008 and the related financial crisis. Yet excluding the recession of 2008 from the decade, the growth rate for the first eight years of the 2000s was still only 2.6%. Further, cumulative economic growth throughout the decade of the 2000s did not exceed 2.7%. It would have required an unusual surge—near 4.5% annually—in the final two years for the full decade to reach the historical average annual growth rate of near 3%.
This sets the stage for a dilemma. Will the decade of the 2010s restore the long-term average by growing at 4%, thereby defying the predominant belief of a slow-growth decade? Was the prior decade of the 2000s an anomaly, with future economic growth simply returning again to its long-term trend of 3%? Did something change ten years ago, and has economic growth downshifted to a level near 2%, or as some might contend, could the rate be even lower due to the economic, financial, and/or policy headwinds in front of us? All three scenarios are plausible, which makes economic growth Major Uncertainty #1. The answer to the dilemma has very significant implications for stock market returns over this decade and longer.
Game Changer
Probable Outcomes explores the possibility that future real economic growth, excluding inflation, may have downshifted from its historical trend of 3%. This major issue has not often been considered. In the past century, real economic growth has increased at slightly more than 3% annually. As a result of the relationship between earnings and the economy, EPS has increased at near 3% in real terms.
Therefore the range of the past P/E cycles has been driven by real growth near 3%. That level of growth has been considered a standard assumption. The recent decade and other factors are now challenging that assumption for the future.
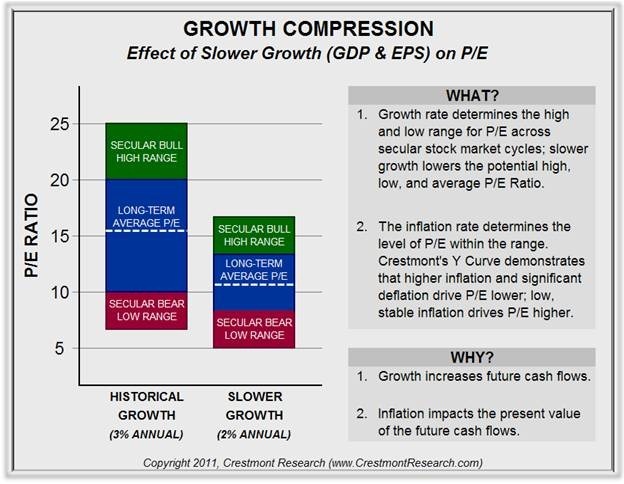
One effect of slower economic and earnings growth is a lower level of earnings in the future. For example, over ten years, $1.00 compounds to $1.34 at 3%, but only to $1.22 at 2%. The difference is about 9.3% less EPS for the stock market under the slower growth scenario. Many analysts would consider that level of variance a minor forecasting error for EPS over a decade. Whether the stock market is 9% higher or lower in a decade is generally small change in the context of overall returns. But the implication of slower growth is far more significant than simply the ending level of earnings. Slower growth is a game changer.
There are three ways to assess its effect, all of which provide similar results. First, an extremely long-term model of earnings growth, dividend payouts, and present value can be constructed to assess the impact of changes in growth on P/E. Second, the academic formulas can be used to derive the effects on P/E based upon perpetual dividend growth. Third, the impact on P/E can be evaluated through the components of stock market return. Since all three approaches reflect comparable results, the more pragmatic third approach will be used to explore the implications.
Before examining the details, consider the significance of the issue. If the future growth rate of earnings decreases by 1% (i.e., near the reduction that would be expected if economic growth decreases by 1%), the historical average for P/E would decline from 15.5 to 11.5—representing a 26% decline in the stock market beyond the 9% shortfall from lower earnings growth. More dramatic, the typical peak in P/E falls from the low to mid-20s to the mid-teens; the adverse impact of slower growth increases at higher levels of P/E.
As previously discussed, inflation causes P/E to decrease because investors demand more return to compensate for higher inflation. Unlike the inflation rate, the growth rate of earnings does not necessarily change the return level that investors expect. They will still expect returns that are commensurate with the stock market and the expected inflation rate, but they will look to replace the contribution of slower earnings growth with another source of return.
To illustrate, assuming that a change in the growth rate does not change the inflation rate, the yields on government bonds can be expected to remain the same. Absent a change in credit quality from slower growth, the risk premium within corporate bond yields would not change. Likewise, the expected return from stock market investments can be expected to remain unchanged due to the growth rate.
When slower growth reduces the contribution of earnings growth to total return, another source of return is therefore needed to fill the shortfall. Stock market investors will not be willing to take equity risk without appropriate equity returns. If bond yields do not change, they will not compromise stock market returns. In this situation, stock market investors will step away until the price of the market declines to again provide appropriate returns. This is the function of markets—finding the price that provides a fair return.
This discussion relates to the effect from changes in the growth rate of earnings. To isolate that factor, several assumptions are needed, basically providing that the relevant relationships remain the same. First, based upon the previous economics discussion, a downshift in economic growth drives slower earnings growth. Second, long-term profit margins remain similar under both growth scenarios, thus the slowing of earnings growth is consistent with the downshift in economic growth. Third, the inflation rate remains constant across both scenarios for growth. Fourth, the expected return for stocks and bonds as well as the related equity risk premium for stocks does not change across both scenarios for growth. In other words, the relevant relationships remain the same.
Of the three components of stock market returns, two are available as sources of return, and the third one represents the way in which returns occur. The first source of return, EPS growth, is defined in this example as either providing 3% or 2% toward to the total return. As a result, the second source of return, dividend yield, will need to increase to compensate for lower earnings growth in the second scenario. Herein is the role of the third source of stock market returns: changes in P/E.
The dividend yield rises as P/E declines and vice versa. For the stock market to be positioned to provide equity-level returns, investors will look for the lower price that enables the dividend yield to rise sufficiently to offset the loss of earnings growth. The required decline in P/E varies based upon the starting level of P/E.
If P/E starts relatively high, then a higher decline is required to provide the required dividend yield increase. For example, if EPS growth drops by 1%, then the change in P/E required to increase the dividend yield by 1% is 7 points from 22 to 15, 4 points from 15.5 to 11.5, and 2 points from 10 to 8.
This shift in P/E relates only to the change in earnings growth. P/E would then be further affected by changes in the inflation rate.
There will likely be, and needs to be, much debate about the accuracy of the estimates presented above, and about nuances that could add decimal points to the factors, or adjust the effects based upon further scenario assumptions. However, whether using long-term models, academic formulas, or the component-based method, all three approaches provide similar results. It is therefore important to recognize that slower growth will have a significant impact on P/E at all levels of the inflation rate. As the discussion evolves into implications and probable outcomes over this decade, slower economic and earnings growth will have a direct effect on the P/E range.
In closing, P/E is a measurement tool for market valuation. The level of P/E, driven by the principles of present value, reflects the price at which the stock market can deliver sufficient returns to compensate for inflation and risk. P/E is driven lower when conditions of inflation change the outlook for required returns. In addition, P/E declines when deflation changes the outlook for the level of future earnings. Of particular note, slower long-term economic and earnings growth reduces future cash flows and drive P/E lower. Conditions of solid long-term earnings growth and low inflation therefore provide the best conditions for a high P/E. In an environment where economic growth and the inflation rate are major uncertainties, an accurate and valid measure of P/E is more relevant and needed than ever before.
Rainbows
Investors are confronting the reality of the current secular bear market. It is both the consequence of the previous secular bull market and the precursor to the next secular bull. The duration of the current secular bear period is uncertain. Should inflation or deflation overcome the economic environment in the near term, this secular bear could end sooner. That reality, however, would cause significant losses to stock market portfolios. If inflation or deflation slowly creeps into the economy, over the next decade for example, then this secular bear will have been one of the longer ones. However, if this decade repeats the relatively low inflation of the past decade, then the secular bear should remain in hibernation.
Beyond the inflation rate, economic growth also will have an impact on the future of this secular bear. Following last decade’s below-average economic growth, this decade could generate above-average growth to offset the recent shortfall. The result would be a solid boost to earnings in this decade. Economic growth, however, also could have downshifted during the last decade to a lower level for the foreseeable future. The result would be a significantly lower range of P/Es, but not necessarily a progression through the secular bear market. The economic growth rate can shift P/E upward or downward, but only inflation or deflation can end a secular bear market.
Whether this secular bear cycle ends in five years, ten years, or beyond, the result will be the start of the next secular bull market, which will bring an extended period of above-average returns. Spring finally will have sprung. This longer-term view of secular stock market cycles is the reason to look out across this secular bear to the next secular bull. The operative word is “across” this secular bear and not “past” it.
“Across” recognizes the reality of the risks and opportunities presented by secular bear markets. “Past” is the ostrich-like approach of ignoring reality with blind hope for an unrealistic outcome. “Across” is enabling, while “past” is disabling.
For investors who are accumulating for the future, secular bear markets are times to build savings for later investment. This is done not only through contributions but also through prudent investing with an absolute return approach to investment returns. The absolute return approach uses the dual strategy of risk management and investment selection.
Investment portfolios should be diversified across a range of investments that are diligently selected and actively managed, especially ones that control risk and enhance return. In particular, investors should not avoid the stock market or bond market. Instead, their objective should be to seek in both markets investments that incorporate elements of skill to enhance returns. Secular bear markets are not periods during which to avoid investing; they are periods that demand an adjustment to investment strategy.
For investors who are more dependent on their current assets, including pension funds and retirees, investment strategy should be paired with early recognition. The principles of absolute return investing are important for preserving capital and generating much-needed returns. But potentially more important than managing the investment portfolio, pension funds and retirees would be well served in this environment to manage their assumptions and expectations. Earlier recognition of secular bear market conditions enables potentially painful adjustments to be smaller. Delaying action until crisis has onset generally brings greater adverse consequences. It is not prudent to hope for the next secular bull market to arrive sooner as a way to address shortfalls. The longer expectations take to adjust, the greater the gap to fill with an increasingly short time to fill it.
John F. Mauldin
johnmauldin@investorsinsight.com
John Mauldin, Best-Selling author and recognized financial expert, is also editor of the free Thoughts From the Frontline that goes to over 1 million readers each week. For more information on John or his FREE weekly economic letter go to: http://www.frontlinethoughts.com/learnmore
To subscribe to John Mauldin's E-Letter please click here:http://www.frontlinethoughts.com/subscribe.asp
Copyright 2011 John Mauldin. All Rights Reserved
Note: John Mauldin is the President of Millennium Wave Advisors, LLC (MWA), which is an investment advisory firm registered with multiple states. John Mauldin is a registered representative of Millennium Wave Securities, LLC, (MWS), an FINRA registered broker-dealer. MWS is also a Commodity Pool Operator (CPO) and a Commodity Trading Advisor (CTA) registered with the CFTC, as well as an Introducing Broker (IB). Millennium Wave Investments is a dba of MWA LLC and MWS LLC. Millennium Wave Investments cooperates in the consulting on and marketing of private investment offerings with other independent firms such as Altegris Investments; Absolute Return Partners, LLP; Plexus Asset Management; Fynn Capital; and Nicola Wealth Management. Funds recommended by Mauldin may pay a portion of their fees to these independent firms, who will share 1/3 of those fees with MWS and thus with Mauldin. Any views expressed herein are provided for information purposes only and should not be construed in any way as an offer, an endorsement, or inducement to invest with any CTA, fund, or program mentioned here or elsewhere. Before seeking any advisor's services or making an investment in a fund, investors must read and examine thoroughly the respective disclosure document or offering memorandum. Since these firms and Mauldin receive fees from the funds they recommend/market, they only recommend/market products with which they have been able to negotiate fee arrangements.
Opinions expressed in these reports may change without prior notice. John Mauldin and/or the staffs at Millennium Wave Advisors, LLC and InvestorsInsight Publishing, Inc. ("InvestorsInsight") may or may not have investments in any funds cited above.
Disclaimer PAST RESULTS ARE NOT INDICATIVE OF FUTURE RESULTS. THERE IS RISK OF LOSS AS WELL AS THE OPPORTUNITY FOR GAIN WHEN INVESTING IN MANAGED FUNDS. WHEN CONSIDERING ALTERNATIVE INVESTMENTS, INCLUDING HEDGE FUNDS, YOU SHOULD CONSIDER VARIOUS RISKS INCLUDING THE FACT THAT SOME PRODUCTS: OFTEN ENGAGE IN LEVERAGING AND OTHER SPECULATIVE INVESTMENT PRACTICES THAT MAY INCREASE THE RISK OF INVESTMENT LOSS, CAN BE ILLIQUID, ARE NOT REQUIRED TO PROVIDE PERIODIC PRICING OR VALUATION INFORMATION TO INVESTORS, MAY INVOLVE COMPLEX TAX STRUCTURES AND DELAYS IN DISTRIBUTING IMPORTANT TAX INFORMATION, ARE NOT SUBJECT TO THE SAME REGULATORY REQUIREMENTS AS MUTUAL FUNDS, OFTEN CHARGE HIGH FEES, AND IN MANY CASES THE UNDERLYING INVESTMENTS ARE NOT TRANSPARENT AND ARE KNOWN ONLY TO THE INVESTMENT MANAGER.
John Mauldin Archive |
© 2005-2022 http://www.MarketOracle.co.uk - The Market Oracle is a FREE Daily Financial Markets Analysis & Forecasting online publication.