


Will Stock Sell-Off Trip Up the Bull Market?
Stock-Markets / Stock Markets 2011 Mar 14, 2011 - 06:34 AM GMTBy: Money_Morning

 Jon D. Markman writes:
Stocks tumbled over the past week - despite a sharp 3% drop in crude oil prices - as investors fretted about the devastating earthquake in Japan, a downgrade of Spain's sovereign debt rating, weak trade data out of China, Germany and the United States and violence in Saudi Arabia.
Jon D. Markman writes:
Stocks tumbled over the past week - despite a sharp 3% drop in crude oil prices - as investors fretted about the devastating earthquake in Japan, a downgrade of Spain's sovereign debt rating, weak trade data out of China, Germany and the United States and violence in Saudi Arabia.
The Dow Jones Industrial Average closed down by 1% for the week, while the Nasdaq Composite Index finished down 2.5% and the Russell 2000 small caps fell 2.7%. The stock sell-off was punctuated by a 90% downside day on Thursday, which means nine out of 10 stocks finished lower and 9/10 of the volume was in declining stocks.
Selling was intense and there appeared to be what The Street calls "real money" selling, which means not just speculators but individuals and institutions. Measures of buying power retreated to its lowest level of the year, while selling pressure is at its highest. Defensive stocks were relatively strong, led by McDonalds Corp. (NYSE: MCD) andAltria Group Inc.(NYSE: MO) - burgers and cigarettes.
So what does it all mean?
As seasoned investors, we need to think about the "signal" provided by the selling as well as the message of the charts. So let's take a look at some squiggly lines and try to see what the great collective unconscious driving the market is trying to tell us. And then we'll look at some historical precedents, and decide what to do about the situation.
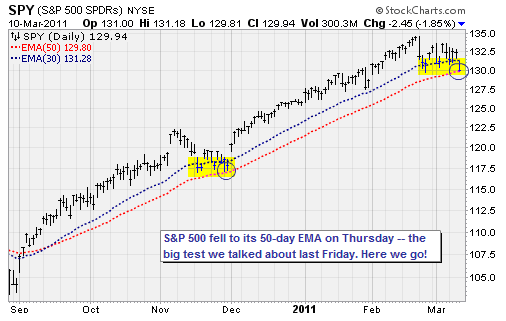
The chart above i is an updated version of one that I have shared with subscribers for two weeks. We have been discussing the fact that markets are all about testing "levels." Stocks go up to a high, come down, and then go back and test that high. Stocks go down to a low, go up, and then come back and test that low.
.Last week, I said stocks were making higher lows but at the same time had not yet tested the 50-day exponential moving average as they had in November. And I said that until that level was tested again, we would not know for sure if bears have what it takes to bring the market down.
Our skepticism about the bears has been well founded. Sellers' vigor has evaporated every time they came close to victory in the past two years. They caught some luck from the European credit crisis last spring and early summer, and managed to pull off a brief 15% decline off the high from late April to late June. But at that time the sellers were aided by the U.S Federal Reserve, which had pulled back from its quantitative easing program at the same time.
What rescued the market in late August last year was U.S. Federal Reserve Chairman Ben S. Bernanke's announcement that the central bank planned to initiate a new round of easing, and that has been the catalyst for the big move since.
After seeing several companies, like Texas Instruments Inc. (NYSE: TXN), report lukewarm mid-quarter earnings updates, it sure looks like growth prospects are not driving the market forward. So the biggest force is the Fed. And that is not good from an abstract point of view because it means gains have been drivenmore by liquidity than by fundamentals.
Markets driven by fundamentals take longer to develop and are more self-sustaining, while markets driven by liquidity have a lot of trouble once government support is pulled.
The most remarkable example of a liquidity-driven market was 1999, when the Nasdaq 100 rose 101% as the Federal Reserve flooded the system with money in anticipation of computer troubles driven by the Y2k bug. Once that threat was gone at the start of the New Year, the Fed started to raise interest rates and the more speculative sections of the market -- tech and dot-coms -- ultimately keeled over into a two-year bear market.
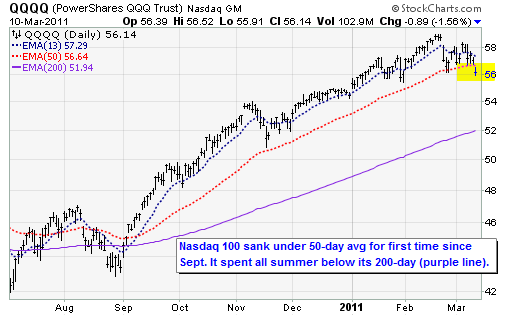
Right now the liquidity-driven sections of the market are without question the commodities -- oil, precious metals, industrial metals and agriculture. But there is obviously some bloom coming off of the technology stocks as well. You can see that the Nasdaq 100 (QQQQ) sank below its 50-day average on Thursday for the first time since September.
It seems like such a long time ago, but don't forget that the QQQQ spent most of the summer under its 200-day average.
So the message of the decline of the Nasdaq and the commodities appears to be a warning that market believes liquidity is likely to be withdrawn soon. We know that the Fed is scheduled to end its quantitative easing program in June, but that is three months away.
The fact that investors are trying to jump the gun on that shows the level of the nervousness about the underpinnings of the recent move. And it may further tell us that the market -- by which we mean all participants working separately to pursue their own self-interest -- believes that there could be a hard landing coming in the economy if and when the Fed withdraws.
This is an out of consensus view that is gaining currency around the edges of the market. Bulls need to step up right away to rescue their uptrend, or they will be swamped very quickly by intensified selling. In short, the 1,300 level of the Standard & Poor's 500 Index must hold over the next week, or we could be in for a multi-week or multi-month decline.
Energy and Libya
Seeing energy stocks moving down while crude oil prices are stabilizing at a high level has perplexed a lot of people. And that confusion was captured smartly in a research note from a prop desk trader on Wednesday night, who wondered aloud whether fund managers are too exposed to the risk of crude oil prices falling, equities falling and the dollar rising.
He observed that speculators are very extended in long crude oil positions, and summed up the dilemma by stating: "Oil falling plus equities falling equals chaos for lots of risk takers. We are probably not there yet but if we get to that point and market turns from 'risk on/risk off' to 'attack all inventoried trades' then that can be a dangerous 'hedged' portfolio. The "hedged portfolio" runs the risk of correlated risk if everyone has the same thought process."
What he is saying is that the smart money has had a trade that goes like this: Buy crude oil as a hedge against the possibility that your stocks are at risk.
By doing this trade, the managers think that their risk of being hurt by turmoil in the Middle East is lessened: If oil goes up then they will make money on that while losing a little on the stocks. Or if oil goes down, then they will lose money on that while making money on their stocks. But if both equities and crude oil prices fall together, then they are in a world of hurt. In short, he's saying that if the risks become "correlated" in that way, the managers are doubly exposed to the risks they were trying to avoid.
This actually happens quite often. And what do you think the result is? Something has to give, and in this case what may be happening is that managers may be selling their growth stocks, particularly tech, as a way to de-risk.
Looking Forward
The recent three-week decline is close to a make or break point. Bulls need to helicopter-drop funds in early next week and rejuvenate their uptrend or we may see a rather impressive spill.
Stocks go down so much faster than they go up that you can make a lot of money quickly. You can be successful in bear markets by being short banks via the ProSharesUltraShort Financials ETF(NYSE: SKF) and long bonds via theiShares Lehman MBS Bond Fund(NYSE: MBB).
I mention this because anyone who has spent a lot of time being short stocks knows that the short side is nothing to trifle with. It's very hard to be consistently successful shorting stocks in a broad uptrend, as we are in now, especially when the Fed has the bulls' back. And that is why I have not recommended any to this point.
But if the bulls decide to throw in the towel for a while, something that we will know soon enough, then we will be all over the inverse ETFs and bond funds. Don't get complacent. Stay tuned.
The Week Ahead
March 14: No releases planned.
March 15: ICSC-Goldman Chain Store, Empire Manufacturing, Import Price Index, Redbook Chain Store, TIC Flows, NAHB Housing Market Index, FOMC Rate Decision, API Crude Inventories.
March 16: MBA Mortgage Purchase Applications, Current Account Balance, Housing Starts, Building Permits, Producer Price Index, DOE Crude Inventories.
March 17: Consumer Price Index, Initial Jobless Claims, Industrial Production, Capacity Utilization, Bloomberg Consumer Comfort, Leading Indicators, Philadelphia Fed Index; EIA Natural Gas Inventories.
March 18: No releases planned.
[Editor's Note: Money Morning Contributing Writer Jon D. Markman has a unique view of both the world economy and the global financial markets. With uncertainty the watchword and volatility the norm in today's markets, low-risk/high-profit investments will be tougher than ever to find.
It will take a seasoned guide to uncover those opportunities.
Markman is that guide.
In the face of what's been the toughest market for investors since the Great Depression, it's time to sweep away the uncertainty and eradicate the worry. That's why investors subscribe to Markman's Strategic Advantage newsletter every week: He can see opportunity when other investors are blinded by worry.
Subscribe to Strategic Advantage and hire Markman to be your guide. For more information, please click here.]
Source : http://moneymorning.com/2011/03/14/...
Money Morning/The Money Map Report
©2011 Monument Street Publishing. All Rights Reserved. Protected by copyright laws of the United States and international treaties. Any reproduction, copying, or redistribution (electronic or otherwise, including on the world wide web), of content from this website, in whole or in part, is strictly prohibited without the express written permission of Monument Street Publishing. 105 West Monument Street, Baltimore MD 21201, Email: customerservice@moneymorning.com
Disclaimer: Nothing published by Money Morning should be considered personalized investment advice. Although our employees may answer your general customer service questions, they are not licensed under securities laws to address your particular investment situation. No communication by our employees to you should be deemed as personalized investent advice. We expressly forbid our writers from having a financial interest in any security recommended to our readers. All of our employees and agents must wait 24 hours after on-line publication, or 72 hours after the mailing of printed-only publication prior to following an initial recommendation. Any investments recommended by Money Morning should be made only after consulting with your investment advisor and only after reviewing the prospectus or financial statements of the company.
Money Morning Archive |
© 2005-2022 http://www.MarketOracle.co.uk - The Market Oracle is a FREE Daily Financial Markets Analysis & Forecasting online publication.