Crude Oil’s March Madness a Boost for Refiners
Commodities / Crude Oil Mar 07, 2011 - 11:28 AM GMTBy: Frank_Holmes
 March Madness is still a few weeks away for college basketball fans but the madness of March is in full swing for the oil sector. Turmoil in the Middle East sent oil prices up more than 6 percent last week. We also happen to be entering a time of year that has historically been good for energy prices and energy equities in recent decades.
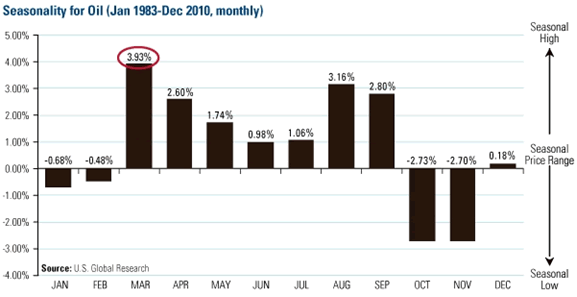
 Going back nearly 30 years, March has been the best month for crude oil. By the end of the month, the price of oil is nearly 4 percent higher on average than the closing price on the last trading day of February.

One reason for this increase relates to the demand pull created by refiners ramping up in advance of the summer driving season. You can see in the above chart that crude prices generally spike in March then continue at a lesser pace through the early summer before picking up again in the late summer. There is typically a big decline from September to October and weak price performance through year end.
This year, oil prices jumped the gun on the seasonal rise because of the unrest in Libya and fears that it may spread to key producers such as Iran, Algeria, Nigeria and Saudi Arabia. Crude oil prices reached $104 per barrel today and we expect this near-term volatility to continue as the geopolitical situation works itself out.
Short-term volatility aside, oil market supply/demand fundamentals were tightening before the turmoil in the Middle East began and we think historically high oil prices are here for the long-term. On Tuesday, the International Energy Agency’s chief economist Fatih Birol supported this opinion when he indicated that “the age of cheap oil is over.”
PIRA, an oil industry analyst, is forecasting West Texas Intermediate (WTI) oil prices will hover around $104 per barrel in 2011 based on tighter oil supply/demand fundamentals, strong medium-term fundamentals and increased financial investment. The firm expects oil demand to grow by 1.6 million barrels per day in 2011 as global GDP growth averages 4.3 percent. Meanwhile, OPEC’s crude output is only expected to increase by 960,000 barrels per day.
Refiners are one of the energy sub-sectors that could benefit the most from higher oil prices. Historically March marks the end of a five-month stretch in which monthly crack spreads (value of refined products minus the prices of the crude oil feedstock) tends to increase. Spreads are generally 4 percent wider in March than February.
This year, some refiners are getting an added bonus because of the significant price difference between WTI and Brent crude oil. Currently, Brent is trading about $15 a barrel higher than WTI, which means that some refiners are buying their oil $15 below global prices. This adds to the profitability of each barrel.
The discount may remain wide for the time being because crude oil supplies from Canada and the mid-continental region of the U.S. have risen faster than demand. These supplies travel to storage facilities at the delivery hub in Cushing, Oklahoma, which makes it difficult to be exported overseas. This creates a supply glut unique to the region.

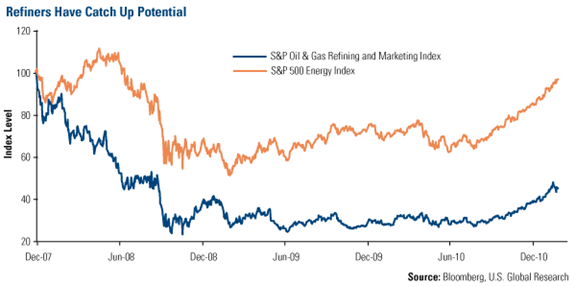
This is a very positive development for a sub-group that has struggled over the past few years. You can see from the chart that refiners have lagged the rest of the oil and gas sector over the past three years. While the S&P Energy Index is returning to peak 2008 price levels, the S&P Oil and Gas Refining and Marketing Index is barely halfway back.
During this madness of March, the increased profitability gives refiners some catch-up potential with the rest of the energy sector. For these reasons, refiners remain an area of focus for the Global Resources Fund (PSPFX).
For more updates on global investing from Frank and the rest of the U.S. Global Investors team, follow us on Twitter at www.twitter.com/USFunds or like us on Facebook at www.facebook.com/USFunds. You can also watch exclusive videos on what our research overseas has turned up on our YouTube channel at www.youtube.com/USFunds.
Please consider carefully the fund's investment objectives, risks, charges and expenses. For this and other important information, obtain a fund prospectus by visiting www.usfunds.com or by calling 1-800-US-FUNDS (1-800-873-8637). Read it carefully before investing. Distributed by U.S. Global Brokerage, Inc.
Standard deviation is a measure of the dispersion of a set of data from its mean. The more spread apart the data, the higher the deviation. Standard deviation is also known as historical volatility. All opinions expressed and data provided are subject to change without notice. Some of these opinions may not be appropriate to every investor. The S&P 500 Stock Index is a widely recognized capitalization-weighted index of 500 common stock prices in U.S. companies. The NYSE Arca Gold BUGS (Basket of Unhedged Gold Stocks) Index (HUI) is a modified equal dollar weighted index of companies involved in gold mining. The HUI Index was designed to provide significant exposure to near term movements in gold prices by including companies that do not hedge their gold production beyond 1.5 years. The MSCI Emerging Markets Index is a free float-adjusted market capitalization index that is designed to measure equity market performance in the global emerging markets. The U.S. Trade Weighted Dollar Index provides a general indication of the international value of the U.S. dollar.
Frank Holmes Archive |
© 2005-2022 http://www.MarketOracle.co.uk - The Market Oracle is a FREE Daily Financial Markets Analysis & Forecasting online publication.


