


U.S. Economy: Some Cracks Showing
Economics / US Economy Nov 05, 2007 - 11:12 PM GMTBy: Donald_W_Dony

 Speculation continues about the U.S. economy. Is it going into a recession or not? There are numerous reports from analysts and economists on credible news outlets like Bloomberg and CNBC about the state of affairs of the American nation. All market pundits seem to provide good evidence in support of their opinions, but I have not seen or heard a commentary on one of the most reliable leading indicators of the economy; the stock market.
I am a great believer in the market as an excellent economic leading indicator. There is no other financial vehicle that comprises more information, opinions or future perspectives than does the stock market. And as the Dow Jones Industrial Average (DJIA) or S&P 500 are within 2% to 3% of their all-time highs, it is hard to imagine that a recession is around the corner.
Equity markets are normally six to nine months ahead of the economy. But this is not to say that the U.S. economy is enjoying a flawless and rose-coloured romp to nirvana. Not at all. There are definitely some deep cracks showing in the plaster. The U.S. housing market is one of the deepest.
One of the best leading indicators on the U.S. housing market is about to take another big step down.
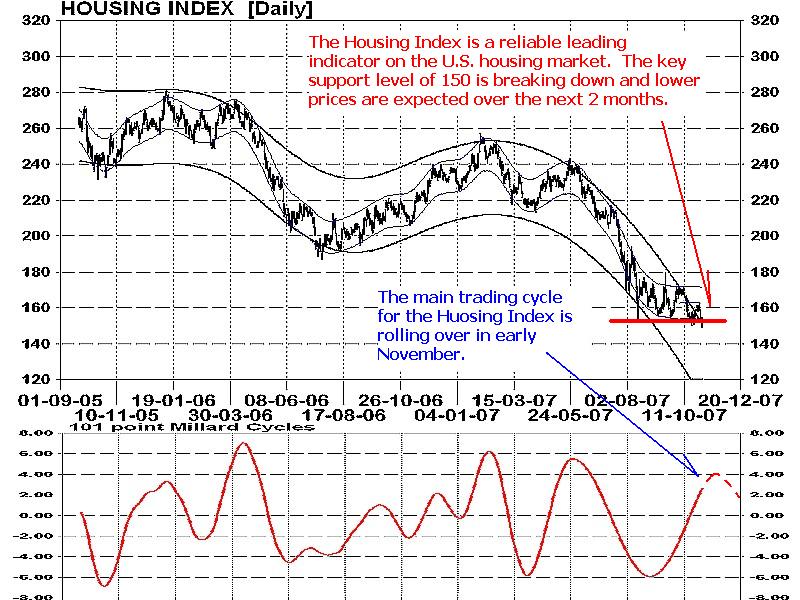
The Housing Index (symbol HGX) has not been able to find a solid foundation since July, when it broke through the 187 support line. In the October issue, I mentioned that there was more weakness coming, and that 140 would likely be the next big test for support for the HGX (Chart 1). The arrival time is expected to be in January 2008. At this point in time, it is too early to tell if the bottom will be found there, but technical models are strongly suggesting that a major low will arrive.
The overall depression in housing prices has a direct spillover to the discretionary sector. More than 74% of all consumer spending is directly related to the home. Weakness in home equity can dramatically reduce purchases of items that consumers wants but do not need.
In Chart 2, of the Consumer Discretionaries exchange-traded fund (ETF) (symbol XLY), you can see what I am talking about. This security has been rolling over since mid-summer 2007. Although a low is expected later this month near the support level of $34, a return to strength is unlikely during this business cycle. It is important to note that weakness in this sector does point to the financial concerns of the most important component of the economy; the consumer.
Wal-Mart, the largest retailer in the world, recently reported that sales growth from its older stores had slumped to their lowest level in 25 years. Neither were the new stores bursting with gold. Sales at Wal-Mart stores open at least a year increased by about 2% in the year through January, which was the smallest gain in at least 27 years.
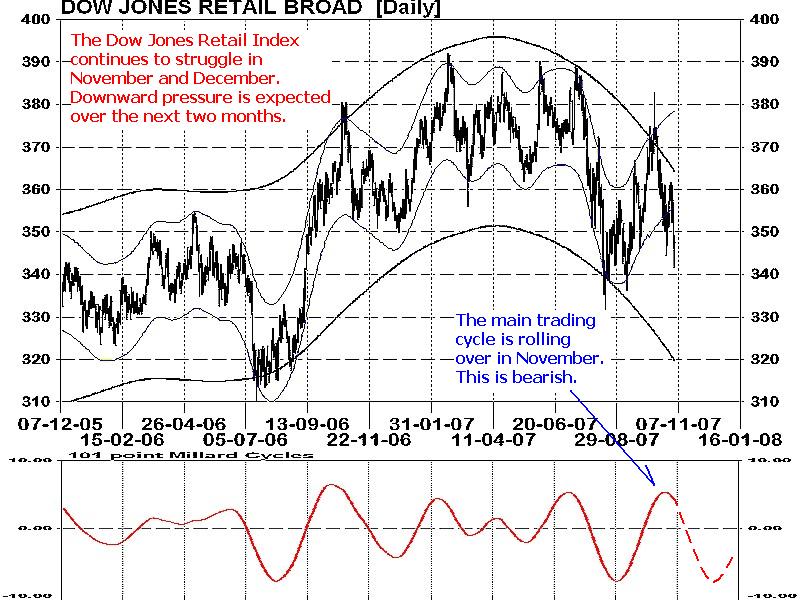
Chart 3, of the Dow Jones retail sector (symbol DJUSRB), shows a group that is flattening out again. After finally advancing out of a two-year consolidation (2004 to 2006), the retail sector is under downward pressure once again.
Good signs for the economy? Not really. But also, no need to panic. A weak retail sector can continue for months before the stock market and the economy shows signs of rolling over; 2005 and 2006 were a good example of that.
Bottomline: Though there are clearly signs of weakness within the U.S. economy, the overall effects of these fundamental issues are not sufficient enough to alter the stock market from its upward trend. The U.S. economy is still expected to expand at 2% in 2007 and continue this pace into early 2008.
Investment approach: As the 4-year business cycle is anticipated to end in 2010, the crest should develop in late 2008 or later. This gradual maturing of the cycle suggests greater relative strength in technology, capital goods and commodity-based equity sectors.
Please refer to the Stock Market Sector Rotation Model on the homepage of the technical speculator.com
The above article is an excerpt from the November newsletter. This complete newsletter is now posted on the technicalspeculator.com
By Donald W. Dony, FCSI, MFTA
www.technicalspeculator.com
COPYRIGHT © 2007 Donald W. Dony
Donald W. Dony, FCSI, MFTA has been in the investment profession for over 20 years, first as a stock broker in the mid 1980's and then as the principal of D. W. Dony and Associates Inc., a financial consulting firm to present. He is the editor and publisher of the Technical Speculator, a monthly international investment newsletter, which specializes in major world equity markets, currencies, bonds and interest rates as well as the precious metals markets.
Donald is also an instructor for the Canadian Securities Institute (CSI). He is often called upon to design technical analysis training programs and to provide teaching to industry professionals on technical analysis at many of Canada's leading brokerage firms. He is a respected specialist in the area of intermarket and cycle analysis and a frequent speaker at investment conferences.
Mr. Dony is a member of the Canadian Society of Technical Analysts (CSTA) and the International Federation of Technical Analysts (IFTA).
Donald W. Dony Archive |
© 2005-2022 http://www.MarketOracle.co.uk - The Market Oracle is a FREE Daily Financial Markets Analysis & Forecasting online publication.