


A Strong NYSE Stock Market Index
Stock-Markets / Stock Markets 2011 Mar 04, 2011 - 11:41 AM GMTBy: Marty_Chenard

The NYSE Index is an exceptionally important index to follow because of its size, composition, the fact that it embodies so many program trades, and because of the focused activity coming from Institutional Investors.
So, what the NYSE Index is doing, how it is trending, and how strong it is are all very important elements relative to what the rest of the market is doing.
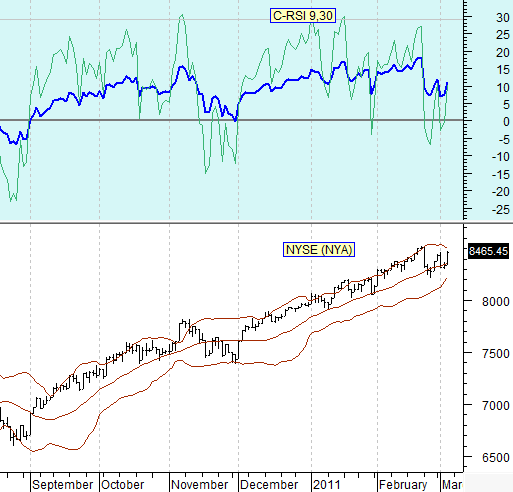
In terms of measuring Strength, using a 9 day and 30 day Relative Strength indicator can be very powerful. As you probably know, the Relative Strength index moves from a value of 0 to 100 with 50 being neutral. Since it is a continuum move from 0 to 100, a level of 50 can seem just part of the movement ... when in fact, it is a critical division level between being Positive and Negative.
This is THE reason why we zero base the Relative Strength Index and call it the C-RSI on our charts. To zero base the RSI index, we simply subtract a value of 50 from each daily reading. That way, a RSI reading of 50 becomes a C-RSI value of 0 which is Neutral. Then ... above or below zero becomes a very clear visual picture of what is happening without having to interpret RSI values.
Here is what is important:
When the 30 C-RSI goes positive with the 9 C-RSI above it, then that is a very strong up condition. When the 9 C-RSI falls below the 30 C-RSI, then market strength is waning. And when the 30 C-RSI goes into negative territory, then the market is in trouble.
When we use the C-RSI indicator, we use it with Market Trending Models, Institutional Accumulation/Distribution data, and with inflowing or outflowing Liquidity data.The combination not only gives accurate market shifting signals, it also tells investors WHY a shift is occurring.
So ... take a look at the chart below and see what happened to the Stock Market's strength yesterday.
Have a great weekend, and we will see you on Monday.
** Feel free to share this page with others by using the "Send this Page to a Friend" link below.
By Marty Chenard
http://www.stocktiming.com/
Please Note: We do not issue Buy or Sell timing recommendations on these Free daily update pages . I hope you understand, that in fairness, our Buy/Sell recommendations and advanced market Models are only available to our paid subscribers on a password required basis. Membership information
Marty Chenard is the Author and Teacher of two Seminar Courses on "Advanced Technical Analysis Investing", Mr. Chenard has been investing for over 30 years. In 2001 when the NASDAQ dropped 24.5%, his personal investment performance for the year was a gain of 57.428%. He is an Advanced Stock Market Technical Analyst that has developed his own proprietary analytical tools. As a result, he was out of the market two weeks before the 1987 Crash in the most recent Bear Market he faxed his Members in March 2000 telling them all to SELL. He is an advanced technical analyst and not an investment advisor, nor a securities broker.
Marty Chenard Archive |
© 2005-2022 http://www.MarketOracle.co.uk - The Market Oracle is a FREE Daily Financial Markets Analysis & Forecasting online publication.