


Inflation-Proofing Your Investments
Stock-Markets / Stock Markets 2011 Mar 03, 2011 - 03:53 AM GMTBy: Paul_Lamont

 With interest rates over 15% in 1981, Harry Browne and Terry Coxon penned Inflation-Proofing Your Investments. They began:
“It’s obvious now that inflation isn’t a temporary problem that will soon disappear.”
Most people would assume that the rest of the book would only be about investments that perform well during rising inflation. Instead, the authors describe the two ways that inflation can end; the supply of money can stop growing or the demand for money can increase. This turned out to be quite a timely and profitable lesson.
In 1981, Federal Reserve Chairman Paul Volker unexpectedly let interest rates float and money supply growth was reduced. Rising inflation disappeared with a severe 2 year recession. Interest rates fell for 30 years (and counting). What was widely expected... turned out to be entirely incorrect.
“The obvious is obviously wrong.” - Joseph Granville
Clearly, the early 1980s were a different time. For instance, we now have a Fed that is trying to pump up the money supply. But the expectation of a continual inflation is as widespread.
Precisely because it has become obvious, inflation will end. We suspect this will happen because of the second scenario described in Inflation-Proofing Your Investments; the demand for money will increase. Here’s how:
Falling Prices in Real Estate (Yes, Again)
Home prices “have fallen to their lowest points since the housing bubble burst.” (For some perspective, the Dow Jones Industrial Average would be at 6500.) But to “bring us back down to the long run average” as suggested by Robert Shiller (Case-Shiller Index, author of Irrational Exuberance) home prices will need to fall an additional 25%.
“An International Monetary Fund study found that in advanced lands, the negative effects of house price declines are twice as great per percent decline in price as stock market crashes. This is because more people own their homes than own equities, they borrow more heavily on houses than stocks, and that greater leverage is more likely to drag down mortgage financiers than is the case with stock market lenders.” – A. Gary Shilling. The Age of Deleveraging. 2011.
The mortgage financiers (the banking sector) are responding to the fall in prices by reducing their loan loss reserves (their rainy day fund). According to Fortune, Sheila Blair, the head of the FDIC, “called out the bankers after the FDIC's third-quarter report, saying the decision to juice profits now at the expense of slimmer reserves put the banking sector's safety at risk.” We expect the number of banks on the FDIC’s problem bank list to continue to hit new highs. And real estate asking prices to fall dramatically when forced to auction. Just as in 2008, the demand for money will rise swiftly because the banks will again be scrambling to raise reserves and cover losses.
Not to be outdone by the bankers, investors are behaving just as imprudently.
Stock Market Valuation
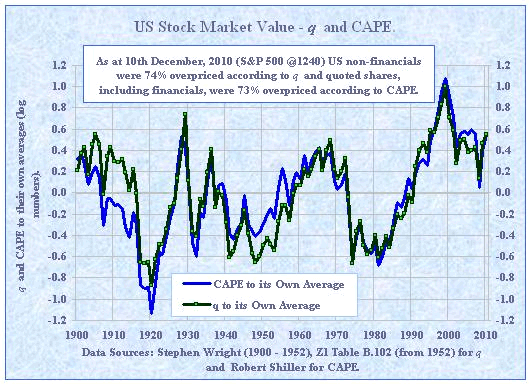
The chart below from Smithers & Co. uses Robert Shiller’s P/E Ratio (blue) and James Tobin’s Q Ratio (green) to show stock market valuations going back to 1900. In 2000, stocks were as expensive as they have ever been. Since that time we have had two recessions which have dampened the public’s mood for stocks somewhat. In 2009, stocks reached their fair value.
As we stated in February 2009’s Sharp Selling Will Lead To A Sharp Bounce:
“We do not expect that this is the ultimate low, merely a level that will support a multi-month bounce. This reflationary bounce will be much stronger (and possibly last longer) than any other rally we have seen since October 2007. Its purpose is to put to rest the widespread fear currently in the market.”
As the chart shows, as of December 2010 stocks are roughly 70% overpriced. The widespread panic that was present in the market in early 2009 has dissipated. The WSJ reports that the same folks who sold at the bottom in 2009 are now confident enough to get back into the market. We couldn’t be more bearish. Just as we expect real estate prices to revert to the mean, we expect stocks to do what they have always done historically; move from overvalued to undervalued.
“Equities become cheaply slowly… If one excludes the 1929-32 bear market, the average period for the adjustment in valuations was 14 years.” - Anatomy of a Bear: Lessons From Wall Street’s Four Great Bottoms. Russell Napier. 2005.
This means that following the historical path for stocks, the S&P500 will hit 400 in 2014. What would cause this undervaluation?
“A material disturbance to the general price level will be the catalyst to reduce equities to cheap levels. On three occasions - 1921, 1949 and 1982 - the disturbance was a period of high inflation followed by deflation, although in 1982 deflation was confined to commodity prices. There was no initial inflation in 1932, but there was a material disturbance to the general price level in the form of severe deflation.” - Anatomy of a Bear: Lessons From Wall Street’s Four Great Bottoms. Russell Napier. 2005.
How To Inflation-Proof Your Investments: Prepare For Deflation with Cash
As the previous quote suggests, investors dumped stocks in masse when deflation followed inflation. During periods of high costs, debtors get squeezed. When the stock market was peaking out in September of 2007 we stated:
“Protectionism, environmental regulation, less migrant workers, energy costs, weather, Chinese growth, we don’t know what ‘reason’ will be attributed to agricultural price increases. But we expect food prices (and cotton!) to dramatically rise in 2008… Of course this will further squeeze the homeowner trying to make a payment on an adjustable rate mortgage.”
Remember oil at $140 a barrel? This helped break the financial system in 2008. We look for it to happen again in 2011. As our last report in December of 2010 stated:
“In mid-2008, commodity rises did herald the coming credit crisis. We would like to note that this year’s investment outperformer is indeed input costs. We would not rule out a final spike in commodities early in 2011 before another credit crunch ensues, though it is not necessary.”
While commodities could spike higher into this summer (possibly with panic hoarding involved), we expect all prices to fall dramatically and surprisingly over the next three years. Just as we did in the Summer of 2008, we are urging investors to use this time to reduce risk, get liquid and secure your investment portfolio. Meanwhile, Wall Street is selling investors over the waterfall.
Playing the Global Float
Looking around the globe, we are amazed at the leveraged situation. It is much worse than in 2007. In China, bankers have blown up a property bubble and now are finding cash hard to come by. In Europe, whole countries are bankrupting themselves (and possibly their neighbors) to bail out their banking systems. In the United States, (as mentioned before) banks are burning through their reserves at the cusp of another property decline. Municipal governments have spent themselves into trouble. In Illinois, the state is even borrowing to pay its pension obligations. The Federal government is also spending much more than it is bringing in. Stock market investors are buying everything they can and doing it with borrowed money. Even money market funds are low on pure cash. The entire system is a network of dubious loans. The demand for cash in a global panic will be a sight to behold.
“Fish see the worm, not the hook.” – Chinese proverb.
Whip Inflation Now - WIN
Whip Inflation Now was a national effort proposed by President Gerald Ford to beat high inflation in 1974. Most of you may remember the red WIN buttons. According to Wikipedia, critics of the program subsequently turned the red buttons upside down (NIM) to stand for “Need Immediate Money.”
By Paul Lamont
www.LTAdvisors.net
At Lamont Trading Advisors, we provide wealth preservation strategies for our clients. For more information, contact us . Our monthly Investment Analysis Report requires a subscription fee of $40 a month. Current subscribers are allowed to freely distribute this report with proper attribution.
***No graph, chart, formula or other device offered can in and of itself be used to make trading decisions. This newsletter should not be construed as personal investment advice. It is for informational purposes only.
Copyright © 2010 Lamont Trading Advisors, Inc. Paul J. Lamont is President of Lamont Trading Advisors, Inc., a registered investment advisor in the State of Alabama . Persons in states outside of Alabama should be aware that we are relying on de minimis contact rules within their respective home state. For more information about our firm, or to receive a copy of our disclosure form ADV, please email us at advrequest@ltadvisors.net, or call (256) 850-4161.
Paul Lamont Archive |
© 2005-2022 http://www.MarketOracle.co.uk - The Market Oracle is a FREE Daily Financial Markets Analysis & Forecasting online publication.