Time of Truth for Amgen
Companies / Company Chart Analysis Mar 01, 2011 - 04:46 AM GMTBy: Mike_Paulenoff
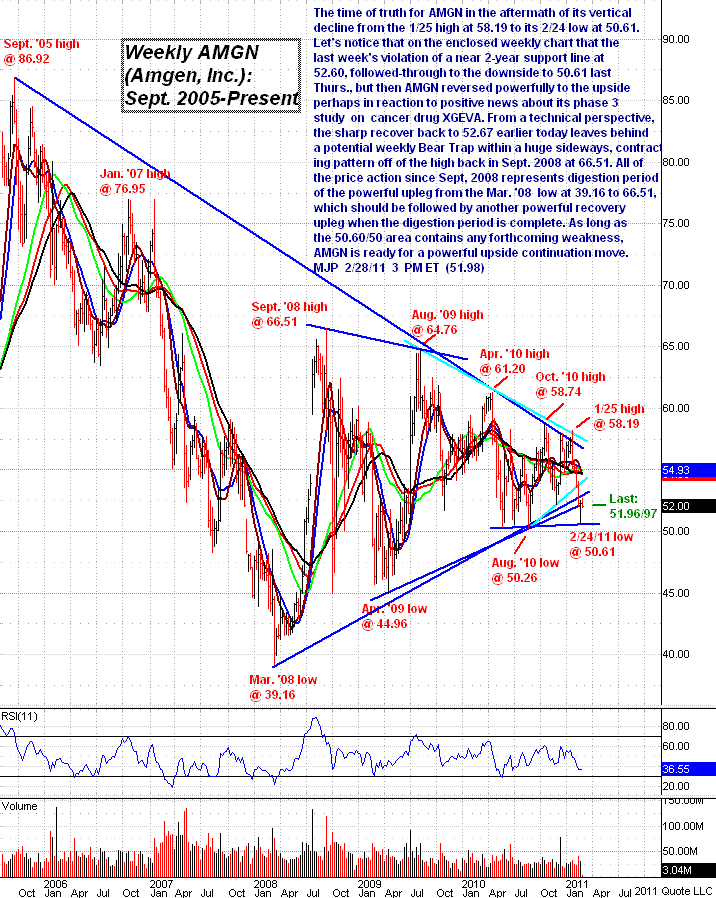
The time of truth for Amgen (AMGN) in the aftermath of its vertical decline from the Jan 25 high at 58.19 to its Feb 24 low at 50.61.
Let's notice that on the enclosed weekly chart that last week's violation of a near two-year support line at 52.60 followed-through to the downside to 50.61 last Thursday, but then AMGN reversed powerfully to the upside -- perhaps in reaction to positive news about its phase 3 study on cancer drug XGEVA.
From a technical perspective, the sharp recover back to 52.67 earlier today leaves behind a potential weekly Bear Trap within a huge sideways, contracting pattern off of the high from September 2008 at 66.51. All of the price action since that time represents a digestion period of the powerful upleg from the March 2008 low at 39.16 to 66.51, which should be followed by another powerful recovery upleg when the digestion period is complete.
As long as the 50.60/50 area contains any forthcoming weakness, AMGN is ready for a powerful upside continuation move.

Sign up for a free 15-day trial to Mike's ETF & Stock Trading Diary today.
By Mike Paulenoff
Mike Paulenoff is author of MPTrader.com (www.mptrader.com), a real-time diary of his technical analysis and trading alerts on ETFs covering metals, energy, equity indices, currencies, Treasuries, and specific industries and international regions.
© 2002-2011 MPTrader.com, an AdviceTrade publication. All rights reserved. Any publication, distribution, retransmission or reproduction of information or data contained on this Web site without written consent from MPTrader is prohibited. See our disclaimer.
Mike Paulenoff Archive |
© 2005-2022 http://www.MarketOracle.co.uk - The Market Oracle is a FREE Daily Financial Markets Analysis & Forecasting online publication.


