Stocks Test Support, Gold Broadening Top, China Stalls as USD Tests Lows Again
Stock-Markets / Financial Markets 2011 Feb 26, 2011 - 04:20 PM GMT The FDIC Average Weekly Closures May be Rising.
The FDIC Failed Bank List announced only one new bank closure this week. U.S. regulators said they seized a failed Illinois bank Friday, the second from that state this year. The Federal Deposit Insurance Corp. said it received Valley Community Bank of St. Charles, Ill., and entered a purchase-and-assumption agreement with First State Bank of Mendota, Ill., to take over the failed bank.
As Conference Board/UMichigan Find Confidence At 3 Year High, Rasmussen Says Investor Confidence Plunges To 2011 Lows(ZeroHedge) While a few days back Thomson Reuters/University of Michigan "found" that Consumer Confidence had surged to a According to Rasmussen, "investor confidence sinks to another 2011 low." Ok, enough. It is more than obvious to anyone with half a brain that "confidence" is nothing more than a gamed, goal seeked indicator, which is a function purely and entirely of the political agenda of the entity collecting the data. Another great example: while the Consumer Comfort index was managed by ABC until last week, it was scraping all time lows. Then the week it starts being managed by Bloomberg, and, lo and behold: "Consumer Comfort Increases to Highest Level Since 2008." A surge in confidence? Really? On gasoline passing $4?
Marginal Lending Facility Borrowings Plunge - Is The European Liquidity Situation Back To Normal?
(ZeroHedge) After having surged for 6 days starting with a major jump on February 16, from €1.2 billion to €15.8 billion, borrowings under the ECB's 1.75% Marginal Borrowing Facility plunged overnight from €14.9 billion to €2.2 billion. As was reported previously, the supposedly responsible banks for this surge in borrowings were Ireland's two most insolvent financial entities…We’ll find out this week.
VIX Found Support at the Wedge Trendline.
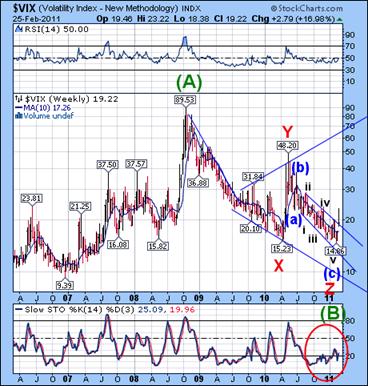 --After gapping through its trendline on Tuesday, VIX appears to have found retracement support at the 50% Fib retracement level and its Wedge trendline. This is truly a bullish breakout of its Broadening Wedge. The implications of this breakout and the larger pattern are staggering. The wave (C) which has just begun must be at least as large as (A). That implies a move to 95.00, which has never been done before
VIX posted its largest 2-day increase since last May. Later in the week it posted its largest 1-day decline since November. We may continue to see large moves in the VIX as it may only have 4 months to reach its target of 95 or higher.
SPX tested 10-week Support.
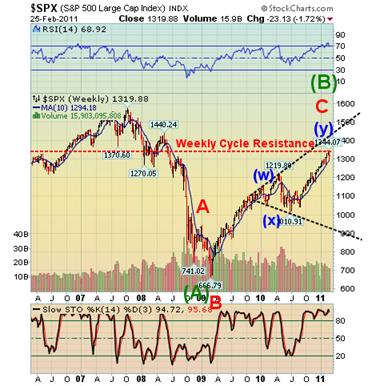 SPX has tested Support at its 10-week moving average. Following that, it appears to have completed a 50% retracement. Wednesday was a Primary Cycle low. This may have pulled the Master Cycle low, due on Monday, to an earlier bottom. This is not uncommon, as the March 9, 2009 low was actually due on March 14th. Had the Primary cycle been due 4-5 days later, it could just as easily have extended it. We’ll know more by mid-week. There is a short-term target at or below 1250.00 that may set the tone for next week.
The alignment of the Cycles gives us an extremely bearish outlook through the end of June.
The NDX closed near the 50% Retracement.
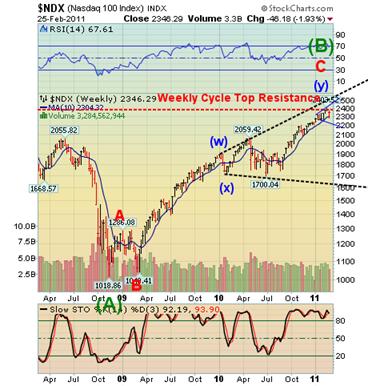 --The NDX closed 2 points above its 50% retracement level of its decline. This week the NDX appears to have completed a reversal pattern within its Orthodox Broadening Top formation that has formed since January 20th. The smaller Broadening Top trendline is at 2200. Once violated, it appears to be targeting the lower trendline near 1600.00 of a larger-degree Broadening Top that dominates the 2010 pattern.
How quickly 2200 gets taken out will tell us more of the speed and the depth of the impending decline.
Gold may be completing point 5 in a Broadening Top.
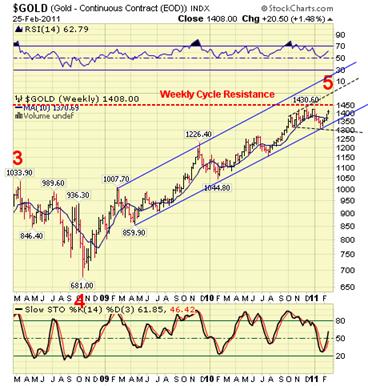 -- The rally this week appears to have changed the pattern in gold. EW, the cycles and the Broadening Formation all suggest a brief new high before the final reversal. The daily Cycle Top resistance is at 1461.87 while the weekly Cycle Top Resistance is at 1450.89. Either target would make a good point 5 in the Broadening Top formation. Monday is the next Pivot day. Whether it uses this Pivot for a turn, or the next, remains to be seen.
(ZH) It’s becoming increasingly annoying watching dealers buy call and sell puts the day before we rally $20, and then the next day buy put and sell calls the day before we drop $20. Yesterday’s sell off from the 1415 area seemed almost orchestrated. Let’s see who gets trapped in the next reversal.
$WTIC closed below its Weekly Cycle Top Resistance.
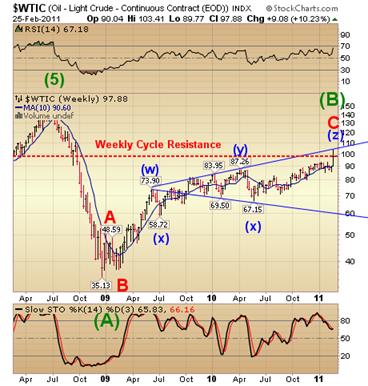 -- $WTIC spiked in a panic-driven rally last week to make a 63.5% retracement of its 2008 decline and touch the upper trendline of its Orthodox Broadening Top Formation. It closed below its Cycle Top Resistance at 99.21, suggesting that this rally may be over.
Although the rally is extremely extended, the big picture is that crude may have finished the largest pre-crash formation in history.
The heavy artillery in crude is out. And while margin hikes do nothing any more for silver and gold, the weak hands in crude have at least two rounds of margin hikes before they are flushed out.
The Bank Index violated its 10-week moving average.
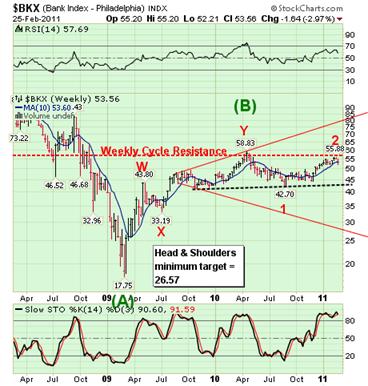 --The $BKX violated its 10 week moving average, then made a 42% retracement. It closed below its 10-week moving average at 53.60 on Friday. It formed a probable right shoulder to a massive Head and Shoulders pattern. It is also a prime candidate for a Flash Crash.
Bank of America Corp. and Wells Fargo & Co., the largest U.S. mortgage firms, said they may face fines or enforcement actions from regulators amid investigations into foreclosure procedures. The probes may also lead to “significant legal costs,” Charlotte, North Carolina-based Bank of America said yesterday in its annual report to the Securities and Exchange Commission. Wells Fargo, based in San Francisco, said in its filing that penalties are likely.
The Shanghai Index stalls above its 10-week moving average.
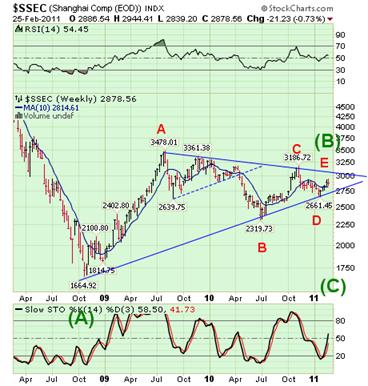 -- $SSEC stalled above its 10-week moving average at 2814.61. Although it is on a buy signal from a Master Cycle low, it may be ready to turn down out of a potential Triangle formation. The reason for my change of view is a new reversal pattern at the top of a zig-zag, suggesting that the most recent rise from the low may be a wave E.
You can still see the smaller triangle formation in the center of the chart. Patterns do fail and it appears that, in the absence of any alternative, it was still an “anchor point” until a better alternative emerged. The larger Triangle pattern is bearish, suggesting a possible target of 1240.00.
USB overtakes its 10-week moving average.
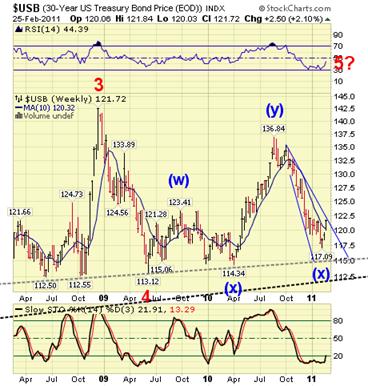 -- $USB gapped above its 10-week moving average, confirming its buy signal. It is still within its descending Broadening Wedge, which is a continuation formation. Last week I expected to see a very sharp rally from this bottom. This week it reached the trendline of its declining Broadening Wedge in the largest gain since last May. The daily chart calls for a possible small pullback before pushing through the Broadening Wedge formation later in the week. Weekly Stochastics are very bullish.
$USD is testing its lows again.
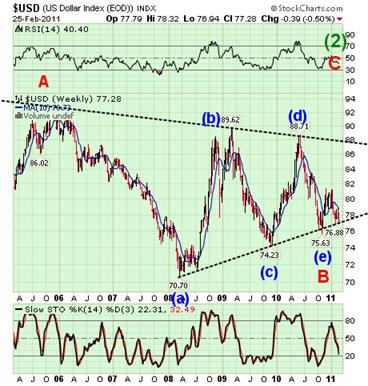 -- $USD appears to be testing its giant Triangle trendline again. One revelation about the dollar is that wave (e) may break outside the Triangle. I am relaying this information because an important Pivot low may be due this Friday, March 4th. A potential target appears to be 76.26, which doesn’t appear to violate the November 4 low at 75.63. It may even go lower, as an extension of wave (e).
The Federal Reserve's stimulus plan has months to run, but some analysts are already wondering how the central bank plans to drain the massive liquidity it added to banks' coffers so that it doesn't unleash inflation and damage the dollar. The worry exists that if a sizeable portion of that glut were to be lent out by banks in a solidly recovering U.S. economy, inflation could rise above the Fed's desired upper range of about 2%.
Traders alert: The Practical Investor is currently offering the daily Inner Circle Newsletter to new subscribers. Contact us at tpi@thepracticalinvestor.com for a free sample newsletter and subscription information.
Our Investment Advisor Registration is on the Web
We are in the process of updating our website at www.thepracticalinvestor.com to have more information on our services. Log on and click on Advisor Registration to get more details.
If you are a client or wish to become one, please make an appointment to discuss our investment strategies by calling Connie or Tony at (517) 699-1554, ext 10 or 11. Or e-mail us at tpi@thepracticalinvestor.com .
Anthony M. Cherniawski, President and CIO http://www.thepracticalinvestor.com
As a State Registered Investment Advisor, The Practical Investor (TPI) manages private client investment portfolios using a proprietary investment strategy created by Chief Investment Officer Tony Cherniawski. Throughout 2000-01, when many investors felt the pain of double digit market losses, TPI successfully navigated the choppy investment waters, creating a profit for our private investment clients. With a focus on preserving assets and capitalizing on opportunities, TPI clients benefited greatly from the TPI strategies, allowing them to stay on track with their life goals
Disclaimer: The content in this article is written for educational and informational purposes only. There is no offer or recommendation to buy or sell any security and no information contained here should be interpreted or construed as investment advice. Do you own due diligence as the information in this article is the opinion of Anthony M. Cherniawski and subject to change without notice.
Anthony M. Cherniawski Archive |
© 2005-2022 http://www.MarketOracle.co.uk - The Market Oracle is a FREE Daily Financial Markets Analysis & Forecasting online publication.


