


Crude Driving Stock Market, Elliott Wave Analysis for Week Starting 28th Feb
Stock-Markets / Stock Markets 2011 Feb 26, 2011 - 06:04 AM GMTBy: Tony_Caldaro

 This week markets, worldwide, took their biggest hit since the second week in November on civil unrest in Libya and a spike in Crude oil prices. WTIC started the week at $88.80/bbl and spiked, in three days, up to $103.40 on supply concerns. The US equity market responded with its largest pullback since November: -3.7%, on economic concerns of surging energy costs. Crude pulled back in the last day and a half to end the week at $97.90, upper mid-range for the week. Equity markets rebounded on that pullback. For the week the SPX/DOW were -1.9%, and the NDX/NAZ were -1.9%.
Asian markets lost 2.2%, European markets dropped 2.4%, the Commodity equity group was +0.5%, and the DJ World was -1.6%. As the commodity bull market continues, Crude has now again becomes an important variable for the equity markets. Economic reports were mostly mixed on the week: seven up and five down. On the upside, consumer confidence/sentiment rose, along with existing home sales, durable orders, the monetary base, the WLEI and weekly jobless claims improved. On the downside, Q4 GDP was lower, along with the M1-multiplier, Case-Shiller and FHFA housing prices, and new home sales. Next week is a busy one, economically. Friday’s Payrolls report highlights the week, along with ISM, Auto sales and the FED’s beige book.
LONG TERM: bull market
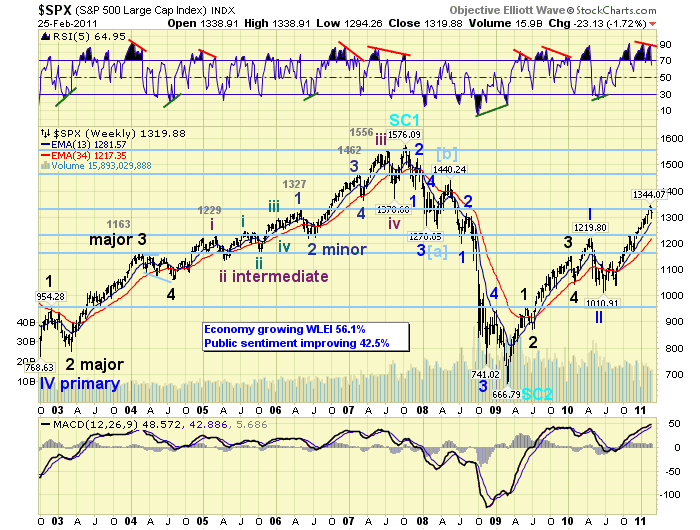
Whether in a bull market or bear, occassionally there will be upside/downside surprises that seemingly just appear out of nowhere. We experienced one this week. Whenever these type of events unfold it is always important to focus on the big picture. In our case, the big picture is that we are in a long term bull market and a medium term uptrend within that bull market. As events unfolded, in this holiday shortened week, the medium term uptrend came under pressure, where it remains. Yet, this event is only a temporary glitch for the bull market. Our medium term uptrend has been rising for seven months and is overdue for a correction. This is quite normal during bull markets. And, especially in bull markets during secular bear cycles with their accompanying commodity bull markets. A quick glance at the weekly chart below illustrates this weeks activity in relation to the bull market quite clearly.
MEDIUM TERM: uptrend in jeopardy
As you can observe from the chart above this uptrend has gone on for quite a while without a correction. It is the longest uptrend of the entire, nearly two year, bull market. There is a negative RSI divergence at the SPX 1344 high, but no downturn in the MACD yet. Should this pullback take the market to lower lows next week it is quite likely we will get an OEW downtrend confirmation, and a correction will be underway. The SPX 1344 high will then be labeled Major wave 1 of Primary wave III and the correction Major wave 2. Support for this correction would be in the area of Intermediate waves three and four, which is illustrated in the chart below. The range for these waves is SPX 1173 – 1227.

After Major wave 2 concludes, we would still need Major waves 3, 4 and 5 to complete Primary wave III. Then a Primary wave IV and a Primary wave V. Lots of time and higher prices ahead for this bull market.
We are carrying an alternate short term SPX count on the DOW daily chart, which suggests this is just another pullback in an ongoing medium term uptrend. Should the market make new highs this would become the preferred count. Next week’s market action should be quite telling as to which scenario is in force. The key, we believe, will be how the Crude market acts next week and going forward. It is in a medium term uptrend, and we are expecting higher prices ahead.
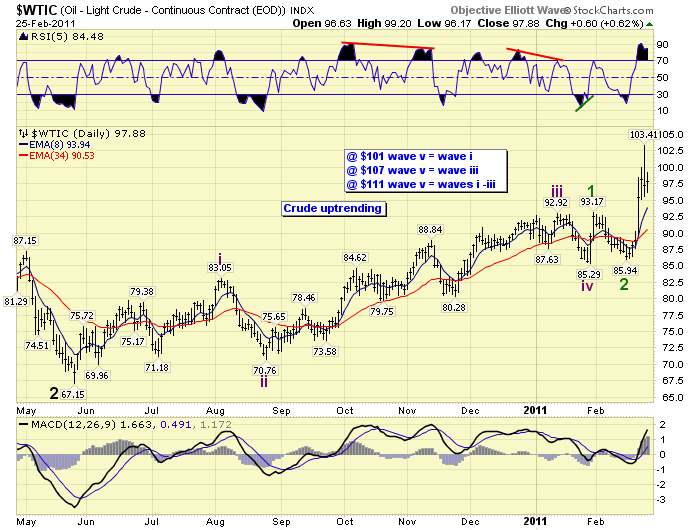
As you can observe from the chart above the uptrend started in January at $85.29. The first two of five waves completed at $93.17 and $85.94. After that low Crude spiked in a third wave hitting $103.41 on thursday in overnight trading. It could spike higher again to continue wave 3, or consolidate around current levels for a while to put in a wave 4. Then wave 5 should take it to new highs for this uptrend. We posted several uptrend targets based on the previous waves of the same degree. The first target at $101 has already been exceeded. The $107 and/or $111 levels would be next. Longer term, we are expecting Crude to retest its 2008 high, around $148, before its bull market ends. Therefore, the Crude factor, in relation to the equity market, is here to stay.
SHORT TERM
Support for the SPX is back to 1313 and then 1303, with resistance at 1363 and then 1372. Short term momentum ended the week slightly overbought.
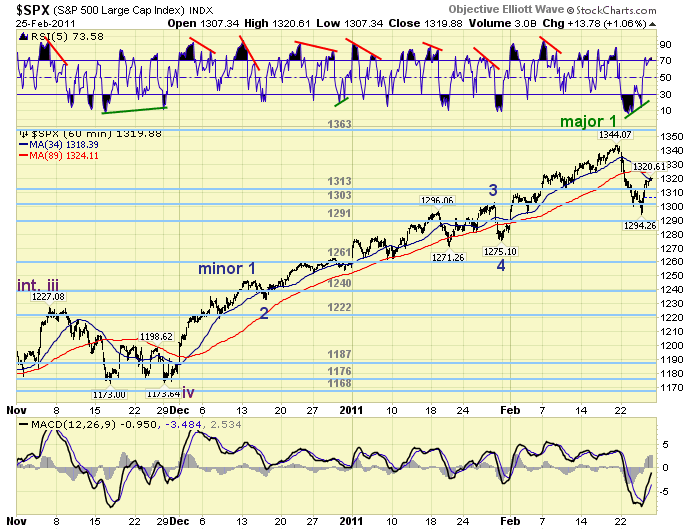
The above chart displays our preferred short term count. We posted a tentative Major wave 1 green label at the recent SPX 1344 high. As noted above, a continuation of this pullback to lower lows next week would likely confirm an OEW downtrend. Typically when downtrends begin the daily RSI, refer to the daily chart above, gets oversold and then a counter rally takes it back to neutral before heading lower again. We already had both the oversold and neutral bounce back this week. Should the RSI clear neutral and head back to overbought the selling pressure is off, and the uptrend would likely resume. A downturn, from around current levels, to oversold in the RSI would likely be followed with an OEW downtrend confirmation and the much awaited correction would be underway. Under either scenario the bull market will resume sooner, or later. Best to your trading!
FOREIGN MARKETS
Asian markets were all lower, uniformly, on the week for a net loss of 2.2%. Only Hong Kong’s HSI and India’s BSE remain in downtrends.
European markets were all lower on the week for a net loss of 2.4%. All indices we track remain in uptrends.
The Commodity equity group was mixed on the week for a net gain of 0.5%. Russia’s RTSI soared 3.5% on the rally in Crude, while uptrending Canada’s TSX and downtrending Brazil’s BVSP lost ground.
The DJ World index remains in an uptrend but lost 1.6% on the week.
COMMODITIES
Bonds gained 0.9% on the week and appear to be uptrending, but not confirmed yet.
Crude is uptrending and gained 10.2% on the week. Nat Gas may have bottomed.
Gold gained 1.5% on the week benefitting from the overall rise in commodities. It’s close to confirming an uptrend. Silver is in a confirmed uptrend and making new bull market highs.
The USD was not much of a safe haven this week as it remains in a downtrend and lost 0.6%. The uptrending Euro gained 0.6%, and the Yen gained 1.8%.
NEXT WEEK
Busy week ahead economically. Monday at 8:30 Personal income/spending and PCE prices. Then around 10:00 the Chicago PMI and Pending home sales. Tuesday we have Construction spending, ISM manufacturing and Auto sales. Wednesday the ADP index in the morning, then the FED’s beige book in the afternoon. On thursday, weekly Jobless claims, Productivity and ISM services. On friday, the Payrolls report, the Unemployment rate, and Factory orders. As for the FED, chairman Bernanke has a busy schedule this week. On tuesday, Senate testimony at 10:00. On wednesday Congressional testimony at 10:00, and then a speech in NYC at 8 Pm that night. Vice chair Yellen gives a speech in France at 10:00 EST on friday. Best to your week!
We’re heading out on another road trip this friday. Have made arrangements for internet access again, but the friday update may be later than normal. Weekend update should be on time. Will do our best to keep up with the emails. This should be the last road trip for a while.
CHARTS: http://stockcharts.com/def/servlet/Favorites.CServlet?obj=ID1606987
http://caldaroew.spaces.live.com
After about 40 years of investing in the markets one learns that the markets are constantly changing, not only in price, but in what drives the markets. In the 1960s, the Nifty Fifty were the leaders of the stock market. In the 1970s, stock selection using Technical Analysis was important, as the market stayed with a trading range for the entire decade. In the 1980s, the market finally broke out of it doldrums, as the DOW broke through 1100 in 1982, and launched the greatest bull market on record.
Sharing is an important aspect of a life. Over 100 people have joined our group, from all walks of life, covering twenty three countries across the globe. It's been the most fun I have ever had in the market. Sharing uncommon knowledge, with investors. In hope of aiding them in finding their financial independence.
Copyright © 2011 Tony Caldaro - All Rights Reserved Disclaimer: The above is a matter of opinion provided for general information purposes only and is not intended as investment advice. Information and analysis above are derived from sources and utilising methods believed to be reliable, but we cannot accept responsibility for any losses you may incur as a result of this analysis. Individuals should consult with their personal financial advisors.
© 2005-2022 http://www.MarketOracle.co.uk - The Market Oracle is a FREE Daily Financial Markets Analysis & Forecasting online publication.