Gold Rally About to Reverse to the Downside Again
Commodities / Gold and Silver 2011 Feb 20, 2011 - 07:11 AM GMTBy: Clive_Maund
 Gold and silver have reversed to the upside and advanced substantially exactly as predicted in the last updates posted on 30th January, and now the majority of commentators are raving bullish again, but the internal technical condition of the sector following this rally suggests that it is about to reverse to the downside again, although longer-term the outlook remains strongly bullish.
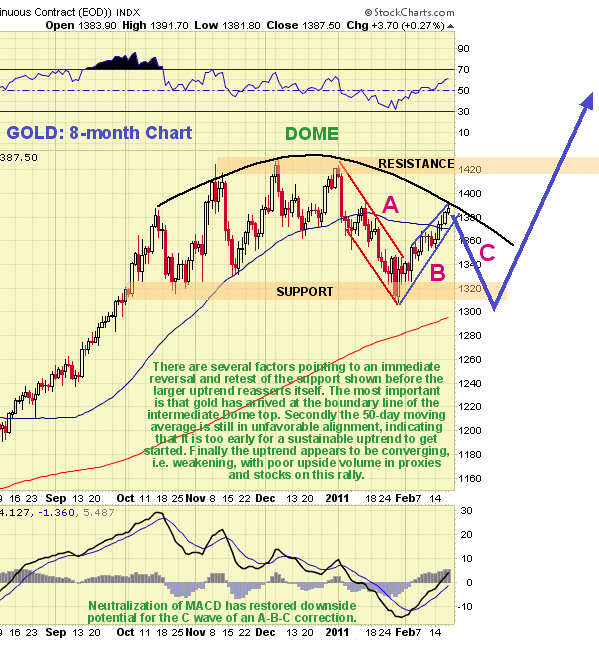
On the 8-month chart for gold we can an array of factors pointing to a probable reversal to the downside here. In the first place it has rallied up to the strong resistance at the boundary of the Distribution Dome shown that has capped rallies for many months now. Secondly, the 50-day moving average is still in unfavorable alignment, indicating that it is too early for a sustainable uptrend to get started - this indicator looks like it first wants to drop down closer to the 200-day moving average before a major uptrend can begin, which would be normal. Thirdly, the uptrend from the end of last month appears to converging, meaning that it is a bearish Rising Wedge, which is another factor portending a reversal, particularly as upside volume in gold proxies and PM stocks has been noticably poor on this rally, which is why we ditched some of them last week for a good profit, although if we had a time machine we would zip back and sell them on Friday instead. It will take a clear break above the Dome pattern to negate this short-term bearish picture.
On its 2-year chart we can see that gold rallied from its long-term uptrend as we had expected. However, from this chart it is clear that if gold reacts back to the first support level shown and its 200-day moving average as expected, it will result in a marginal breach of the uptrend, which is not regarded as a problem. In addition we should note that a deeper reaction back to the strong support in the $1250 area is possible that would serve to more adequately correct the entire advance from 2009. Again, this would not mean an end to the bullmarket - we would simply have to draw a less steep uptrend line from the April 2009 low beneath the correction bottom later that would define a more moderate - and more sustainable - uptrend.
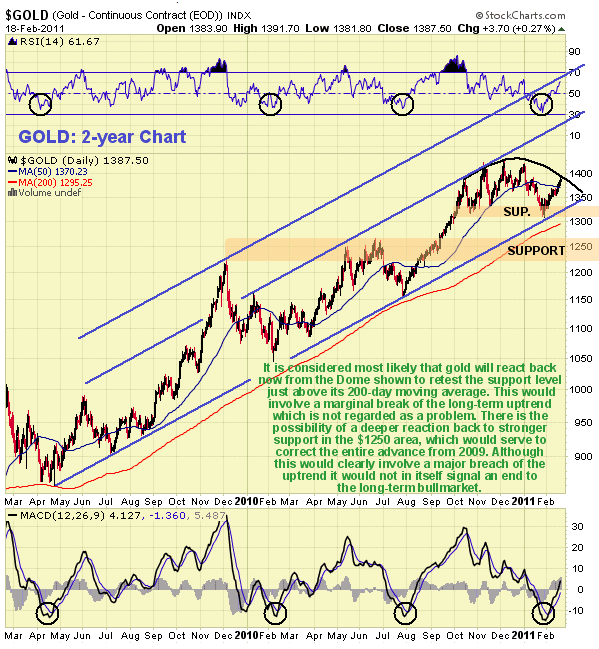
As you can see on this chart predicting the latest advance did not involve any rocket science or complex algorithms. Look at all the circles on the RSI and MACD indicators and what happened after these indicator lows were hit. Given that gold was on its long-term trendline and just above its rising 200-day moving average at the time of its latest circles it should have been obvious to anyone with an ounce of common sense that a rally was probable - but unfortunately common sense is not to be found in abundance at market bottoms.
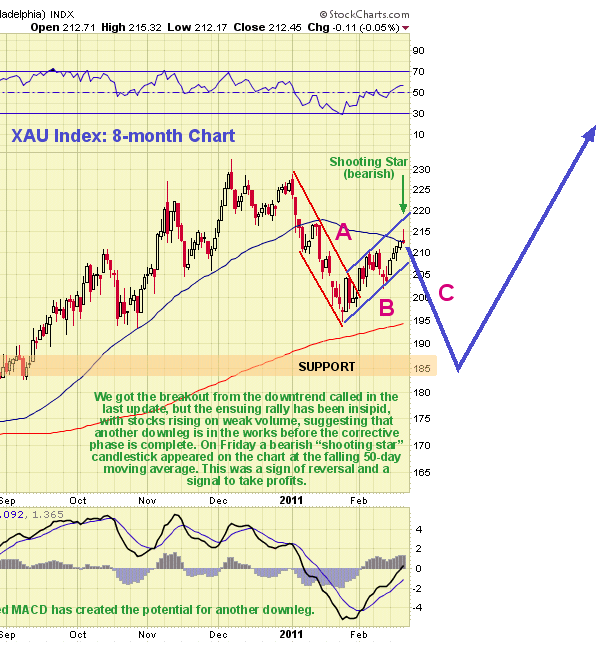
We have alluded above to the shaky technical condition of the sector after this rally, notwithstanding silver's sparkling performance, and now we will proceed to examine it on a couple of stock index charts. On an 8-month chart for the large stock XAU index we can see that this rally looks really feeble, and while we have made more than a few shillings out of it, this chart suggests that we should be prepared for an immediate or imminent reversal to the downside. Moving average alignment is decidedly unfavorable with the 50-day dropping away towards the 200-day but still quite a long way above it, suggesting that the corrective phase is still in force and that the recent rally has been the middle B wave of a 3 wave A-B-C correction which has unwound the short to medium-term oversold condition and thus renewed downside potential, and with a bearish "shooting star " candlestick appearing yesterday that borders on being a more bearish "gravestone doji", as the index tried to rise up above the 50-day moving average, the time of reversal to the downside may well be upon us. The gravestone doji differs from the shooting star in that the open, close and low for the day are at the same point. We cannot see the marked bearish volume pattern of the recent past on this XAU index chart, but we can on the Market Vectors Gold Miners index, which we will now take a look at.
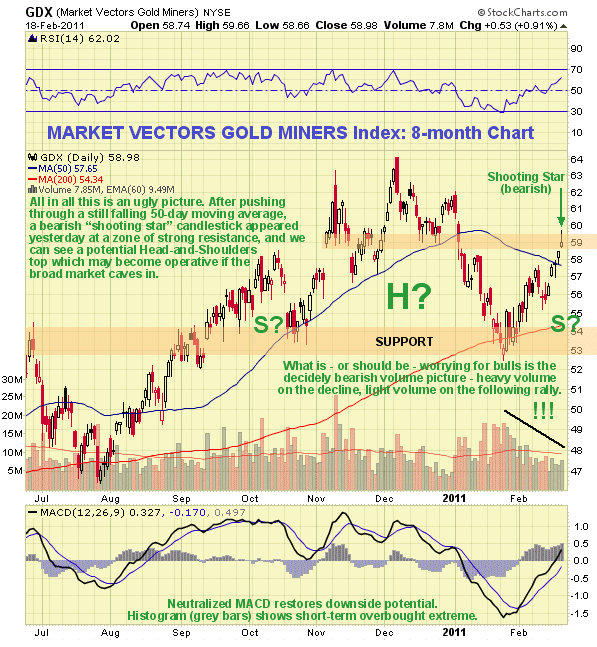
The 8-month chart for the Market Vectors Gold Miners index presents a surprisingly ugly picture, given the fine performance put in by many stocks in the recent past and the sparkling performance put in by silver. In the first place we can see that the heavy reaction in January brought this index back down to the vicinity of its October lows, opening up the possibility that this month's rally from deeply oversold may end up forming the Right Shoulder of a Head-and-Shoulders top, a possibility that could easily become a reality if the broad stockmarket's "forever" rally comes to an abrupt end. The appearance of the bearish shooting star candlestick by the close of Friday's session after the index hopped some way above its falling 50-day moving average was therefore an ominous development. Even more worrying (worrying for committed bulls, that is) is the decidedly bearish volume pattern of recent weeks. After heavy volume on January's decline, which is itself bearish, volume has been conspicuous by its absence on the rally - and it should be other way around. What this implies is that the rally of recent weeks is a countertrend rally, the B wave of an A-B-C correction. Pulling all of this together it looks like the sector is about to abruptly reverse to the downside, and given that the MACD indicator's oversold reading has now more than fully neutralized, it is clear that there is plenty of scope for a significant drop from here. Note that a parallel potential Head-and-Shoulders top exists in the XAU index, but it has not been drawn on to reduce clutter.
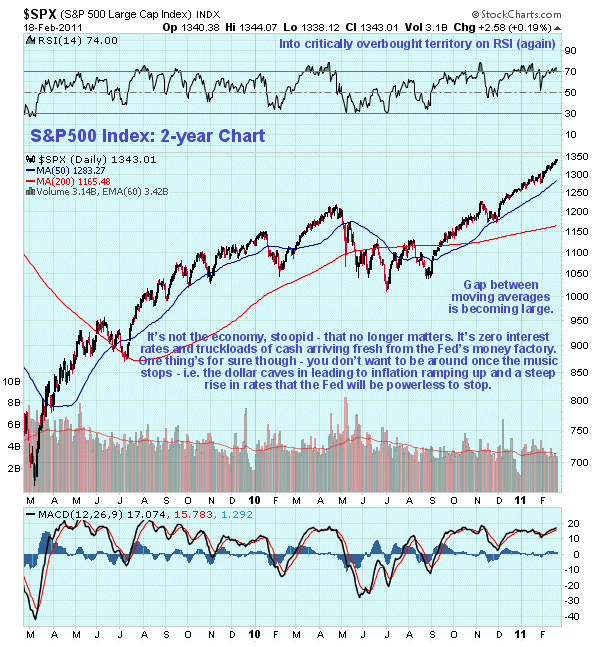
If the potential Head-and-Shoulders tops on PM stock index charts became operative it would of course imply a deeper correction for gold, and would likely take the wind out of silver's sails, but in addition it would also imply a reversal in the broad US stockmarket. We have all sat and watched with complacent amusement as the broad market has floated steadily higher, as if it was on its way to heaven, greatly assisted by truckloads of freshly printed cash from the Fed arriving at the tradesman's entrance of Wall St, and the policy of maintaining zero interest rates and printing however much money is required to keep the system limping along, which has been going on for so long now that it has become accepted as a new normality by many. So let's be clear - it is totally abnormal and is likely to have dire consequences. In the first place this policy of ballooning the money supply and holding interest rates at zero, which has become a necessity due to the magnitude of debt, must undermine the dollar, and to the extent that it continues will lead to its collapse. A collapse in the dollar will mean high inflation as the cost of imports ramps up. Next, interest rates must rise accordingly, as only someone intent on financial suicide would lend out money at say 2% per annum when inflation is running at say 10%. If the Fed attempts to hold rates at 0% lenders will simply bypass it. Given the massive and crippling level of debt in the US, sharply rising rates will implode the economy, so the moment the market gets its head around the fact that rates are set to rise, which it must once the dollar's decline really accelerates, the stockmarket will cave in, and given that the market tends to discount macro events 6 to 9 months out, it should be obvious that we are drawing ever closer to this turning point. Almost all technical indicators for the broad stockmarket are now firmly in negative territory, many have been so for months and it is only meddling on a grand scale that has kept the uptrend going - so it will be interesting to see what happens once the music stops.
By Clive Maund
CliveMaund.com
For billing & subscription questions: subscriptions@clivemaund.com
© 2011 Clive Maund - The above represents the opinion and analysis of Mr. Maund, based on data available to him, at the time of writing. Mr. Maunds opinions are his own, and are not a recommendation or an offer to buy or sell securities. No responsibility can be accepted for losses that may result as a consequence of trading on the basis of this analysis.
Mr. Maund is an independent analyst who receives no compensation of any kind from any groups, individuals or corporations mentioned in his reports. As trading and investing in any financial markets may involve serious risk of loss, Mr. Maund recommends that you consult with a qualified investment advisor, one licensed by appropriate regulatory agencies in your legal jurisdiction and do your own due diligence and research when making any kind of a transaction with financial ramifications.
Clive Maund Archive |
© 2005-2022 http://www.MarketOracle.co.uk - The Market Oracle is a FREE Daily Financial Markets Analysis & Forecasting online publication.


