


Could Disaster Be Brewing Inside These Popular ETFs?
Companies / Exchange Traded Funds Feb 19, 2011 - 09:49 AM GMTBy: Jared_Levy

 I feel it's our duty here at Smart Investing Daily not only to help you discover new and unique investment opportunities and tactics, but also to warn you of impending potential disasters.
Looking at the financial markets on the surface, many experts are saying that it seems a little "overbought." There is no doubt I am in that camp, but now I am gaining more conviction. Experts use things like price/earnings multiples and technical formations to make these determinations. They also look at the past to make future forecasts.
When determining an "overbought" or "oversold" financial market, I examine several indicators, like the ones mentioned above and several others, to confirm my thinking. But there are a couple of signals that are not being talked about and one that I think can not only give us insight into the real strength of the financial market, but also explain its odd behavior and seemingly unstoppable bullish run. These signals are coming from three index Exchange Traded Funds (ETFs) that are some of the most heavily traded and most popular in the world.
A Growing Problem?
These three ETFs -- Dow Jones Diamonds (DIA:NYSE), S&P 500 (SPY:NYSE) and Nasdaq 100 Index (QQQQ:NASDAQ) -- represent the bulk of the most heavily traded, largest companies here in the U.S. and abroad. Combined, they represent over 600 stocks and the majority of the trading volume here in the U.S. What no one seems to be talking about are the large changes we are seeing in something called "short interest" and the "short interest ratio."
Short interest is the measurement of how many shares are in short positions. When you want to short a stock, you must "borrow" shares from your broker. The broker allows you to sell the stock at one price, with the anticipation that the shares will drop, at which time you can hopefully buy them back at a lower price. That is a short (bearish) position.
Obviously, if the stock rises, you will lose money, and if it keeps rising, you may be forced to buy those shares back, because you are unable to afford the losses in your account. This effect can create something called a "short squeeze," but more on that in just a second.
Now, you would think that short interest on the rise means more and more people are getting short a stock and therefore this increase in bearish sentiment will lead the stock lower... This is partially true.
(By the way, investing doesn't have to be complicated. Sign up for Smart Investing Daily and let my fellow editor Sara Nunnally and I simplify the stock market for you with our easy-to-understand investment articles.)
If you look below at the short interest chart in SPY, which represents the S&P 500 index, you will notice the huge spike in the short interest ratio (green line). The short interest ratio compares the overall short stock positions to the average daily volume of the SPY.
At the end of December, short stock positions represented 2.7 times the average daily trading volume on the SPY (that's very high). When you have that high of a ratio coupled with a little positive news, light volume (like you see in December) and upticks in price, you have the makings for a short squeeze. Short squeezes can drive stocks and indexes violently higher, without rhyme or reason, because the short sellers are trying to buy back their stock and cut their losses.
[A short squeeze also occurred in Netflix (NFLX:NASDAQ) on Valentine's Day.]
Weekly Short Interest Ratio (green line)
Actual short interest amount and volume of SPY
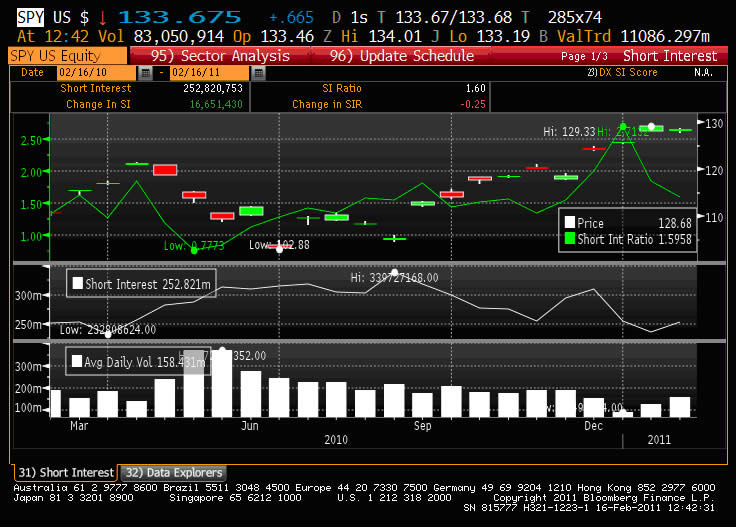
Chart Courtesy of Bloomberg
Perhaps the late 2010 and early 2011 rally that we see in the SPY weekly chart below can be attributed at least partially to a short squeeze. This thesis is supported by a reduction in short interest shares (chart above) as a whole up until the first week of January (white line) as bearish traders cover their losses and buy stock.
Weekly SPY Chart With Volume
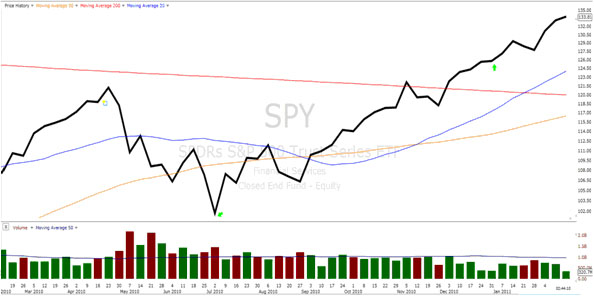
Courtesy of freestockcharts.com
What Happens Now?
Along with the meteoric rise of the SPY, the short interest ratio has been creeping up and short interest itself is also coming back into the marketplace.
Since a ratio low of 0.77 in May, the trend has been higher. Volume has also come back, but nowhere near where it was this time last year. Now that the market is looking more expensive than cheap (like it did mid-2010), those short players that have been creeping into the market may now get the upper hand as investors who are long and have made decent profits are more likely to step aside and let prices drop. In this case the short squeeze may work in the opposite direction, sending prices lower, quickly. I think this trend is notable because it's been a risky, tough trade for anyone who has been short over the past several months and if traders are willing to step up and take that bearish risk, there must be serious conviction.
I will keep you abreast of any major changes in short interest. By the way, the DIA and QQQQ charts look very similar, except for the QQQQ having a major spike in the short interest ratio from July to August ahead of its drop in early August. For now, I remain cautious, much more so than just a couple weeks ago.
Don't forget that if shares of the SPY, DIA or QQQQ are bought or sold, subsequent shares are bought and sold within the individual companies. This effect can drive prices both ways.
I wanted to thank my friends over at OptionsHouse*; they are some of the best and brightest minds in the options business and offered their assistance with my research for this article.
Editor's Note: Access the secret blueprint Wall Street giants use. It could mean a big payoff for you... You could turn $5,000 into as much as $500,000. Earn 12%... 40%... 170% or more. Over $4.5 billion earned already with this proven method. Here's why billions of dollars were made during the Crash. You have to see it to believe it. Read here now...
*Disclaimer: OptionsHouse has no affiliation with Smart Investing Daily, or Taipan Publishing Group. We always recommend you do your homework and due diligence when considering any brokerage or investment service provider. For more information on how to choose a broker that's right for you, please read Taipan Publishing Group's "Guide to Good and Bad Brokers."
Don't forget to follow us on Facebook and Twitter for the latest in financial market news, investment commentary and exclusive special promotions.
Source : http://www.taipanpublishinggroup.com/tpg/smart-investing-daily/smart-investing-021711.html
By Jared Levy
http://www.taipanpublishinggroup.com/
Jared Levy is Co-Editor of Smart Investing Daily, a free e-letter dedicated to guiding investors through the world of finance in order to make smart investing decisions. His passion is teaching the public how to successfully trade and invest while keeping risk low.
Jared has spent the past 15 years of his career in the finance and options industry, working as a retail money manager, a floor specialist for Fortune 1000 companies, and most recently a senior derivatives strategist. He was one of the Philadelphia Stock Exchange's youngest-ever members to become a market maker on three major U.S. exchanges.
He has been featured in several industry publications and won an Emmy for his daily video "Trader Cast." Jared serves as a CNBC Fast Money contributor and has appeared on Bloomberg, Fox Business, CNN Radio, Wall Street Journal radio and is regularly quoted by Reuters, The Wall Street Journal and Yahoo! Finance, among other publications.
Copyright © 2011, Taipan Publishing Group
© 2005-2022 http://www.MarketOracle.co.uk - The Market Oracle is a FREE Daily Financial Markets Analysis & Forecasting online publication.