Stock Price Recovery Rallies for GM, Ford
Companies / US Auto's Feb 18, 2011 - 03:46 PM GMTBy: Mike_Paulenoff
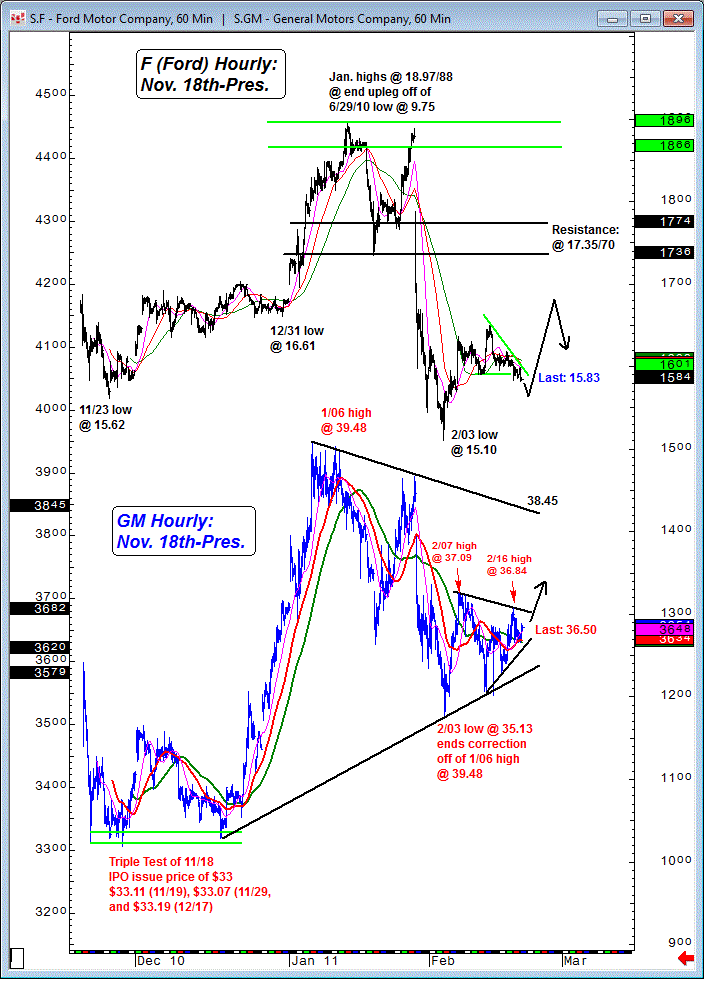
General Motors (GM) and Ford (F) present very different near-term chart structures, with GM exhibiting a more constructive near term pattern than Ford. Nonetheless, both names are in different phases of recovery rallies off of their early February lows.
Reviewing the 60-minute comparison chart on both, we see that Ford's Jan double-top at 18.97 and 18.88 ended the upleg off of the June 29 low at 9.75. Ford has come off the Feb 3 low at 15.10 and is flagging in the mid-15 range.
GM is in a bullish triangle formation, having come off the Feb 3 low at 35.13, which ended the correction off the Jan 6 high at 39.48. Our targets are 38 and then 38.60.

Sign up for a free 15-day trial to Mike's ETF & Stock Trading Diary today.
By Mike Paulenoff
Mike Paulenoff is author of MPTrader.com (www.mptrader.com), a real-time diary of his technical analysis and trading alerts on ETFs covering metals, energy, equity indices, currencies, Treasuries, and specific industries and international regions.
© 2002-2011 MPTrader.com, an AdviceTrade publication. All rights reserved. Any publication, distribution, retransmission or reproduction of information or data contained on this Web site without written consent from MPTrader is prohibited. See our disclaimer.
Mike Paulenoff Archive |
© 2005-2022 http://www.MarketOracle.co.uk - The Market Oracle is a FREE Daily Financial Markets Analysis & Forecasting online publication.


