


Stock Market Pullback Imminent, Cyclical Bull to Continue
Stock-Markets / Stock Markets 2011 Feb 16, 2011 - 08:56 AM GMTBy: John_Hampson

 Let's start by looking longer term.
Cyclical stocks bulls historically end when/with:
Inflation over 4%
10 year treasury yields over 6%
Stock market topping process accompanied by weakening breadth
Yield curve abnormal
Overtightening of interest rates
Whilst these are only guidelines, it should be noted that in Western markets we have some way to go on all, so we might not expect the cyclical stocks bull to end any time soon.
Supporting this, as detailed in my post of February 11th, there are multiple tailwinds for stocks:
QE/Pomo until June
Leading indicators are positive and stable
Money supply growing, money velocity stable
Financial conditions index positive
Latest earnings season has delivered a beat rate in excess of the last 3 quarters
Stocks are cheap relative to bonds historically
Stocks are in the presidential cycle sweetspot in 2011, particularly the first 6 months
One thing has changed since that post, which is the bull market sustainability index reading, which now points to a pullback, and I'll come on to that later.
So, the environment for stocks is currently positive and we have some tools to measure when the cyclical bull is approaching conclusion, so let's turn to forecasting when that conclusion might be.
The strength of this cyclical bull off the March 2009 low historically suggests this will be a prolonged bull of large returns. Laszlo Brinyi's analysis suggests that it should last around 4.5 years, taking us to 2013. The table below shows how such bull markets typically make 4 phases or quartiles (reluctance, digestion, acceptance, exuberance) and that our first phase from March 2009 through to April 2010 was amongst the strongest of any in history. The second phase typically produces much more mediocre returns than the first and should last roughly to June 2011. This phase has so far seen an increase of around 9% so it may be that consolidation lies ahead rather than a continued run up.
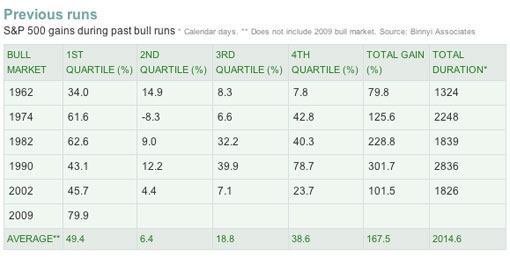
Source: Laszlo Birinyi
Let's home in on two examples from that table that have rhymed well with our current bull so far:
Cyclical bull 2003-2005 compared to our current bull. What happened next:
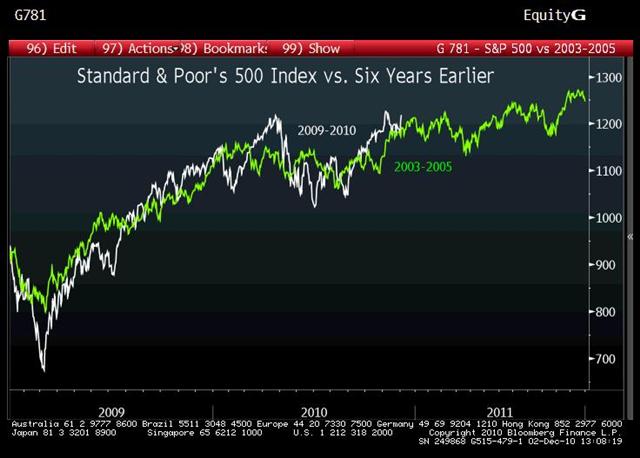
Or cyclical bull 1974 to 1976 compared to our current bull. What happened next:
Source both: The Big Picture
In the second example a gradual market topping process gave way to a new cyclical bear, whereas in the first example, there was a shallower cyclical bull continuation. As we don't yet see evidence of a market topping process and continue to enjoy a significantly positive environment for stocks, the 2005 model is more likely, which would imply a transition into a phase of lesser returns.
We can also guage the likely duration of this cyclical bull by solar cycles. Recessions have typically followed a peak in solar activity:
Source: Amanita.at
And inflation peaks have also correlated with solar peaks:
Source: Amanita.at
This is the current solar activity cycle progression and forecast:
We could therefore expect rising inflation to accompany us to a recession circa 2013. We could therefore perhaps reach inflation and interest rate levels in keeping with historic cyclical bull conclusions around 2012/2013. This fits well with Birinyi's forecast.
Amalgamating all the above, I have a reasonable model of cyclical bull continuation and a strategy of buying the dips until the evironmment for stocks becomes less positive and/or the cyclical bull ending measures start to align. Now let's home in nearer term.
Bringing together various disciplines, a near term pullback in stocks looks imminent:
1. Stocks are entering a small window of negative seasonality over the next few sessions:
Source: MarketSci
2. And in the presidential cycle late February has historically made for a pullback:
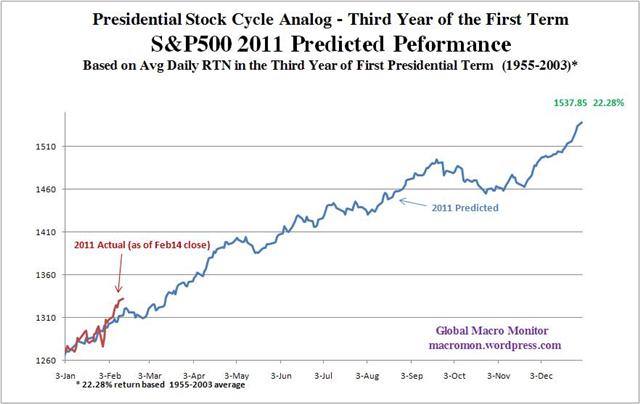
Source: The Big Picture / Global Macro Monitor
3. February 18th is a full moon and there is negative pressure into and around full moons:
Source: Dichev/Janes
4. Cycles also suggest a pullback from here:
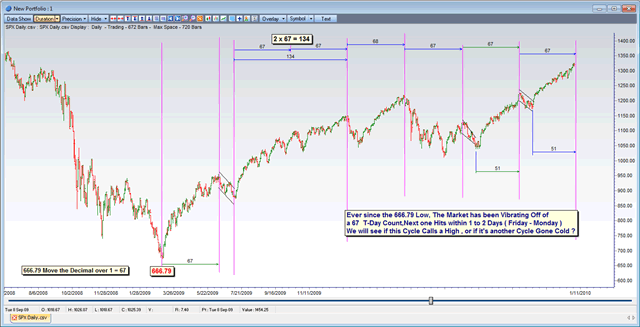
Source: PugSMA
5. Ciovacco's proprietary bull market sustainability index has entered a range that usually means a pullback is imminent (as mentioned above):
Source: Ciovacco Capital
6. Retail investor domestic inflows have historically been a contrarian indicator:
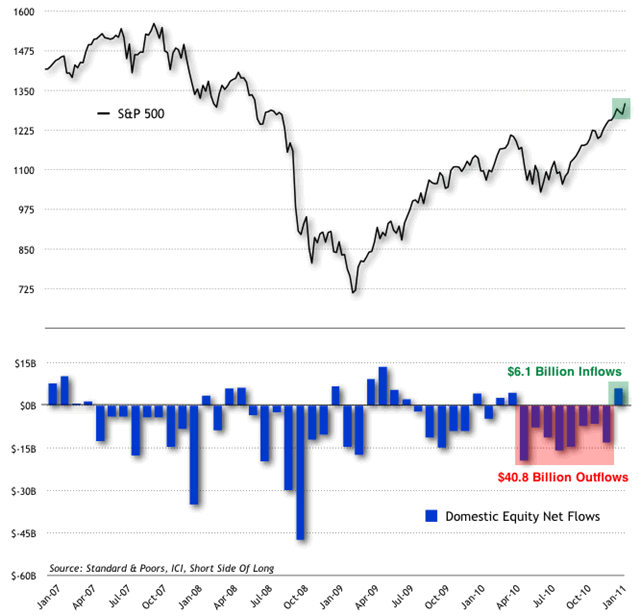
Source: ShortSideOfLong
7. The dumb money is bullish whilst the smart money is bearish:
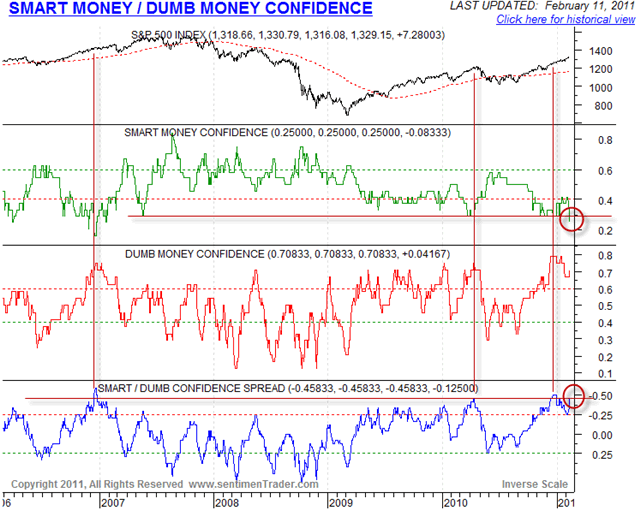
Source: Cobra's Market View / Sentimentrader
However, it should be noted that various other indicators whilst fairly stretched are not at historic extremes, including distance from 200 day moving average, and percentage of stocks above 50 day moving average:
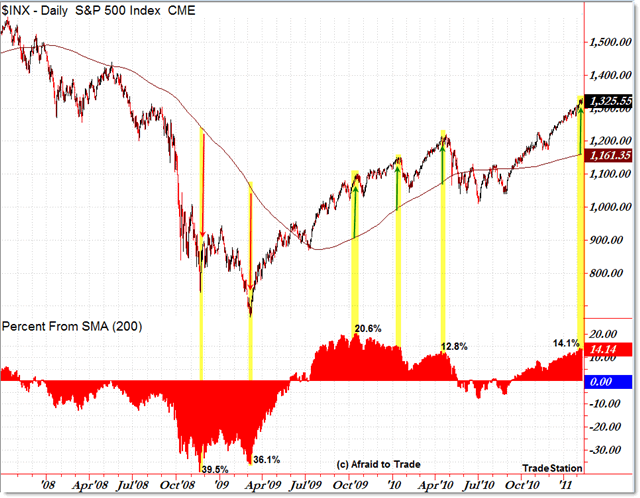
Source: Afraid To Trade
Source: Index Indicators
Due to the tailwinds listed above and the strength of the cyclical bull to date we should not be surprised if the market squeezes indicators to historic extremes. If a near term pullback did emerge, it may not be deep.
In short, the near term presents an opportunity for a market pullback and historic cyclical bull markets also point to a period of shallower returns. But ultimately, measuring the cyclical bull by price, time and character, buying the dips rather than shorting the peaks may be the strategy offering the higher returns throughout 2011.
John Hampson
John Hampson, UK / Self-taught full-time trading at the global macro level / Future Studies
www.amalgamator.co.uk / Forecasting By Amalgamation / Site launch 1st Feb 2011
© 2011 Copyright John Hampson - All Rights Reserved
Disclaimer: The above is a matter of opinion provided for general information purposes only and is not intended as investment advice. Information and analysis above are derived from sources and utilising methods believed to be reliable, but we cannot accept responsibility for any losses you may incur as a result of this analysis. Individuals should consult with their personal financial advisors.
© 2005-2022 http://www.MarketOracle.co.uk - The Market Oracle is a FREE Daily Financial Markets Analysis & Forecasting online publication.
Comments
|
Geno
17 Feb 11, 09:29 |
Largest solar flare in 4 years
http://www.nydailynews.com/news/national/2011/02/17/2011-02-17_solar_flares_could_dazzle_ny_sky.html?r=news lets see what the markets does! |