


Growing Investment Opportunity in Agriculture
Commodities / Agricultural Commodities Feb 16, 2011 - 03:50 AM GMTBy: Frank_Holmes

 With the world nearing 7 billion, there are a lot more mouths to feed. Throw in that many in emerging markets are requiring higher-quality diets and you've got a squeeze on the global food supply.
Bushels of corn reached their highest prices in nearly three years this week after the U.S. Department of Agriculture (USDA) reported that corn inventories will fall to levels not seen since 1996.
 We’ve witnessed nearly a 100 percent surge in the price of corn over the past year as increased demand has been met with diminishing supply. Dry weather conditions due to La Niña in Argentina and other disruptions have shriveled supply despite a near record amount of acreage being planted. Globally, corn consumption has increased 10 percent over the past five years to reach record levels and stock-to-use ratios for corn suggest we’re currently experiencing the tightest global corn market since the late 1970s, according to Macquarie.
This jump is due to increased corn consumption for ethanol and greater demand for feed grain. The USDA estimates that just under 40 percent of U.S. corn production will be consumed for ethanol, up from 31 percent in 2008-2009. China will likely need to import 5 million tons of corn in 2011 in order to meet the country’s booming need for feed grain. In the U.S., an additional 60 million bushels will be used for feed despite a reduction in livestock, according to the Des Moines Register.
Corn is just one part of the food pyramid that is rising. Around the world, prices for wheat, soybeans, cocoa and other grains have jumped in the last 18 months in conjunction with the global recovery. Prices have jumped because demand outstripped supply.
This chart from Potash Corp. shows that grain production has failed to meet consumption in seven of the past 11 years. This is despite producing a significantly larger amount of grain in 2009 than in 2000. Potash Corp. estimates world grain production declined more than 4 percent in 2010. An extreme drought in Russia chopped grain production in the country by 38 percent and 13 percent in neighboring Ukraine.
These tight supply/demand fundamentals reflect the impact of a growing global population and increasing economic strength in emerging markets, Potash says.
As per capita wealth has grown in other countries, there has been a huge jump in demand for grains. This chart shows the amount of bushels consumed as GDP per capita rises.
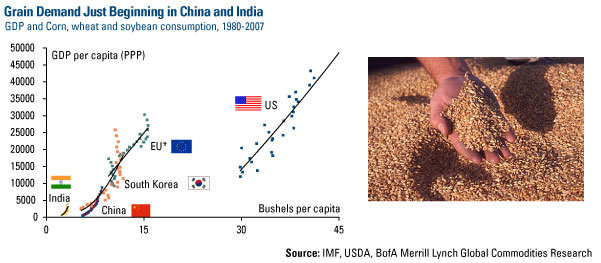
Much of the rise is due to people consuming more meat as their fortunes rise. To meet this higher protein diet, more chickens, cows and hogs are fed grains and demand skyrockets. You can see that China and India are still in the very early stages of increased consumption.
We think the agricultural space is ripe with opportunity. With global grain inventories relative to demand at multi-year lows and the rising emerging market middle class showing a healthy appetite for more meat and dairy products, demand for increased crop yields should remain strong.
None of U.S. Global Investors Funds held any of the securities mentioned in this article as of 02/14/11.
For more updates on global investing from Frank and the rest of the U.S. Global Investors team, follow us on Twitter at www.twitter.com/USFunds or like us on Facebook at www.facebook.com/USFunds. You can also watch exclusive videos on what our research overseas has turned up on our YouTube channel at www.youtube.com/USFunds.
Please consider carefully the fund's investment objectives, risks, charges and expenses. For this and other important information, obtain a fund prospectus by visiting www.usfunds.com or by calling 1-800-US-FUNDS (1-800-873-8637). Read it carefully before investing. Distributed by U.S. Global Brokerage, Inc.
Standard deviation is a measure of the dispersion of a set of data from its mean. The more spread apart the data, the higher the deviation. Standard deviation is also known as historical volatility. All opinions expressed and data provided are subject to change without notice. Some of these opinions may not be appropriate to every investor. The S&P 500 Stock Index is a widely recognized capitalization-weighted index of 500 common stock prices in U.S. companies. The NYSE Arca Gold BUGS (Basket of Unhedged Gold Stocks) Index (HUI) is a modified equal dollar weighted index of companies involved in gold mining. The HUI Index was designed to provide significant exposure to near term movements in gold prices by including companies that do not hedge their gold production beyond 1.5 years. The MSCI Emerging Markets Index is a free float-adjusted market capitalization index that is designed to measure equity market performance in the global emerging markets. The U.S. Trade Weighted Dollar Index provides a general indication of the international value of the U.S. dollar.
Frank Holmes Archive |
© 2005-2022 http://www.MarketOracle.co.uk - The Market Oracle is a FREE Daily Financial Markets Analysis & Forecasting online publication.