


Fed's Gold Bullish Script, Destroying the Dollar and Demolishing the United States
Currencies / US Dollar Feb 15, 2011 - 08:11 AM GMTBy: Jeff_Berwick

 What If We Had a Bubble and Nobody Came?
You could not have written a better script for gold. It is almost as if the US Government and the Federal Reserve are trying to destroy the dollar and demolish the country – and taking most of the western world with it.
At the beginning of this gold bull market, in 2000, no one had ever heard of Barack Obama or Ben Bernanke. But, 11 years later, and an outright socialist profligate spender is President of the US and a College professor who believes in crackpot Keynesian theories about how money printing can save economies is the Chairman of the Federal Reserve.
Yet, it is now 11 years into the most consistent bull market on earth, and hardly anyone owns gold.
The amount of money invested in US Money Market accounts is $2.8 trillion. As comparison, the amount currently invested in Gold ETFs is less than $100 billion.
Talking to the average man on the street is an exercise in futility. Before gold hit $1,000/oz in US dollar terms no one owned gold. Since it has hit $1,000 a few people have become aware of its existence but of those the vast majority will tell you that, “ it’s too late now to buy gold. We missed the run.”
Anyone who has been around for any of the numerous bubbles that have been spawned by the massive amount of monetary inflation over the last few decades knows that this is not what a bubble top looks like. It’s not even what a bubble looks like.
Pets.com was just a domain name and a business plan to sell pet accessories online in 1999 and it had a market capitalization of $300 million and people were begging to get a piece of its IPO. “It’s the new economy,” they said.
Taxi drivers in Las Vegas were buying 4 or 5 houses as speculative properties in 2005. “House prices never go down,” they said.
Yet, gold almost always gets pegged by mainstream media as being “in a bubble” despite showing none of the outward signs of being in a bubble. Not to mention the fact that the mainstream media completely missed the fact that tech stocks and the housing market were in a bubble – but somehow managed to spot this one!
Look at Central Gold Trust (NYSE:GTU TSX:GTU.UN). It is a fund that only holds gold bullion. It is currently trading at less than its Net Asset Value (0.3% discount). In most bubbles, publicly traded holding companies in the hot sector normally trade at large premiums to their NAV. Certainly not at a discount.
In a recent poll by Bloomberg of 1,000 of its subscribers they asked where they saw gold prices going one year from now. 35% said higher, 39% lower and 24% said little changed. They also asked if they thought gold was in a bubble. 52% said yes and 43% said no with the rest saying they didn’t know.
These are simply not the types of numbers you would ever see in a bubble or near the peak of a bubble!
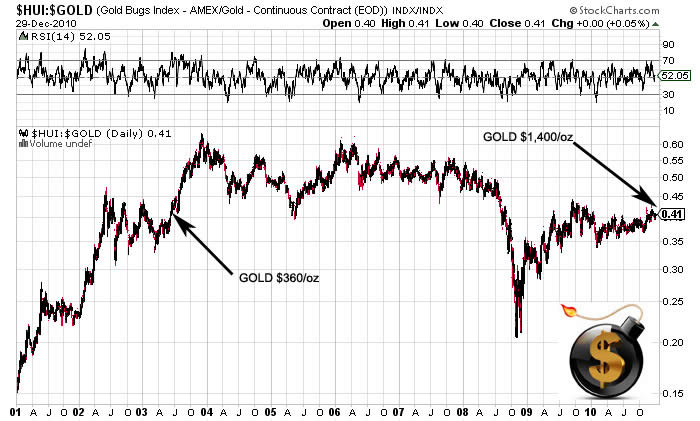
Bubbles only tend to pop once greater than 90% of the general public think it is a sure thing to go higher and to always go higher. And, as we pointed out in the January issue, you certainly wouldn’t expect the producers of an asset that has moved dramatically higher over the last 10 years to be underperforming the asset they produce, which is and has been the case since 2004.
The last time gold stocks traded at the same level compared to gold was in 2003 when gold was $360/oz.
Gold has more than tripled since then and gold stocks have not moved higher as you would expect they would if it were a bubble.
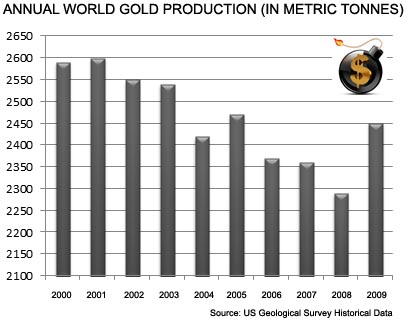
If gold was in a bubble you would certainly expect that annual gold production from mines would have increased dramatically since the price of gold began to rise in 2000. Again, not the case. Gold production peaked out when gold was trading at its lowest levels in 2000 and 2001.
Some say that gold has been in a bull market and that it must be nearing the end of its bull move.
However, it is only in US dollar terms that gold has been in such a stellar bull market. When looking at gold versus other assets, such as oil, gold was in a bear market from 2001 to 2008 when after the “financial crisis” it began to move dramatically higher.
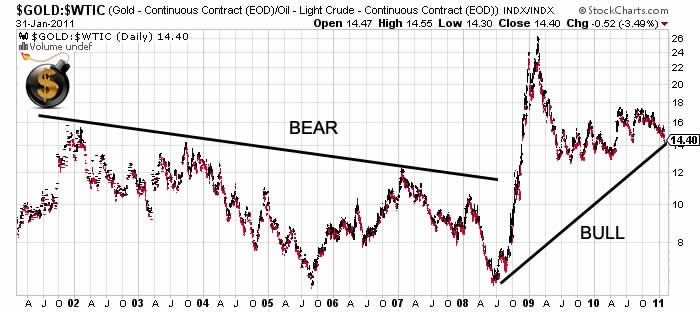
In fact, this chart of gold versus oil explains many of the other seeming irregularities. One of the reasons gold production hasn’t increased over the last ten years is, compared to other assets, gold has been in a bear market until 2008. This also explains why gold stocks have not outperformed gold bullion during that same period.
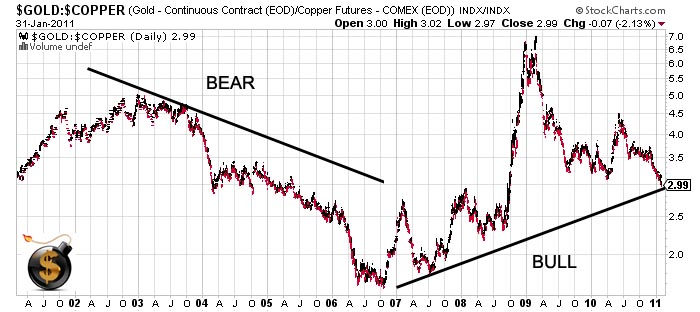
Gold versus copper shows much the same thing.
Lastly, when looking at the past highs in gold and silver in 1980 as adjusted for a more realistic CPI, as calculated by Shadowstats.com, shows that the earlier all-time high for gold of $850.00 on January 21, 1980 would be $7,824 per troy ounce in terms of SGS-Alternate-CPI-adjusted dollars. In like manner, the all-time high price for silver in January 1980 of $49.45 per troy ounce has not been hit since, including in terms of inflation-adjusted dollars. Based on SGS-Alternate-CPI-adjusted dollars the 1980 silver price peak would be $455 per troy ounce.
In other words, hold your gold & silver. This train hasn’t even left the station.
The Dollar Vigilante is a free-market financial newsletter focused on covering all aspects of the ongoing financial collapse. The newsletter has news, information and analysis on investments for safety and for profit during the collapse including investments in gold, silver, energy and agriculture commodities and publicly traded stocks. As well, the newsletter covers other aspects including expatriation, both financially and physically and news and info on health, safety and other ways to survive the coming collapse of the US Dollar safely and comfortably. The Dollar Vigilante offers a free newsletter at DollarVigilante.com.
© 2011 Copyright Jeff Berwick - All Rights Reserved
Disclaimer: The above is a matter of opinion provided for general information purposes only and is not intended as investment advice. Information and analysis above are derived from sources and utilising methods believed to be reliable, but we cannot accept responsibility for any losses you may incur as a result of this analysis. Individuals should consult with their personal financial advisors.
© 2005-2022 http://www.MarketOracle.co.uk - The Market Oracle is a FREE Daily Financial Markets Analysis & Forecasting online publication.