Gold For Valentine's Day
Commodities / Gold and Silver 2011 Feb 15, 2011 - 03:31 AM GMTBy: Anthony_J_Stills
 "Be ashamed to die until you have won some victory for humanity." ~ Horace Mann (1796 - 1859)
Today the White House sent its budget to Congress and it will hit US $1.6 trillion for 2011, well above the previous US $1.3 trillion estimate. The proposed budget deficit for 2012 is US $1.1 trillion. In spite of cutting US $1.5 trillion over the next decade, at no time is the deficit projected to be less than US $655 billion over the next nine years. Don't forget that these are "estimates" and the government is always too low. Now both parties will start to bargain and fight for their respective pork as the deadline to extend the debt ceiling is less than sixty days away. If both parties fail to agree, government would have to shut down operations and that would have a detrimental affect on the US economy. I predict that it will be very difficult for both sides to come to an agreement and that just might prove to be the outside influence that rattles the markets and brings and end to all the exuberance regarding the so-called recovery.
I want to focus on gold because I have the feeling that it is about to take center stage. I have resisted the influence of the crowd and I've insisted that gold is going higher in spite of a lot of press to the contrary. Notable analysts like Marc Faber have called for a correction down to as low as 1,100.00 while some like Elliot Wave's Robert Prechter keep calling for an end to the bull market in the yellow metal. The naysayers turned up the volume when gold recently fell from its all-time high of 1434.10 on December 7th to an intraday low of 1,309.10 on January 28th but the yellow metal seems to finding its way back to higher prices.
During the decline close to 200,000 contracts were liquidated as all the big funds and Johnny-come-lately's abandoned their positions. Now that gold is on the rebound many are calling this a dead cat bounce before the big decline and I think it's a worthwhile exercise to separate fact from fiction. In order to do this I want to first look at the decline from the last all-time closing high and then the rebound that has followed. Unless otherwise mentioned I will be talking about the April gold futures contract. The all-time closing high for April contract was 1,425.10 on January 11th and was followed by a 7.4% decline down to January 27th closing low of 1,319.80. That is a drop of 105.30 over seventeen sessions and compared to past reactions it is in line with the 5.0% to 7.5% seen on previous occasions.
Using intraday numbers, gold fell from the December 7th intraday high of 1,434.10 to the January 28th intraday low of 1,309.10 over an exceptionally long period of 36 days. This was a decline of 125.00, or 8.80%, and is exceptionally shallow given the length of time that it took to find a bottom. In the past all significant declines began with a big drop of 10% to 15% over a short period of time and then gold would slowly trend lower losing another 5% to 7% along the way as it tortured the bulls. This is certainly not the case today. Below I have posted a five-month daily chart for the April contract and I have highlighted the intraday high, the all-time closing high and the recent move higher:
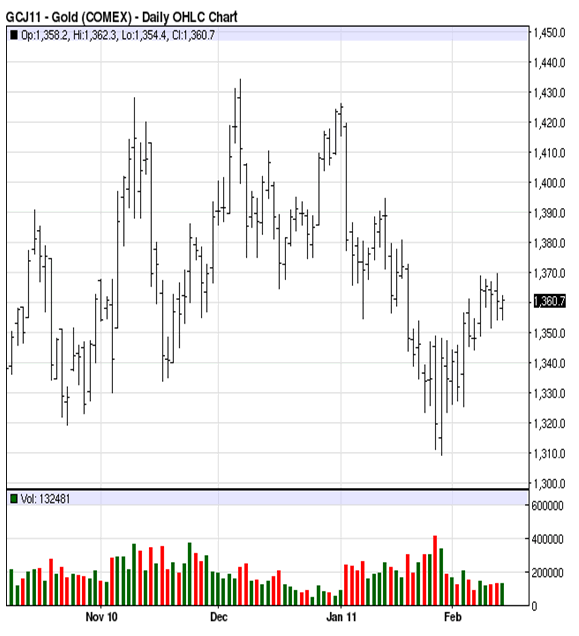
So far, so good! Now let's look at the rebound that has followed. The April gold closed at 1,360.4 on Friday and traded as high as 1,369.70 that same day so it has moved exactly 60.00 up from the intraday low and its done so in just eleven sessions. That means that April gold has recovered almost fifty percent of the decline from the all-time intraday high to the January 28th intraday low in just a quarter of the time that it took for the fall. That is extremely bullish behavior and you won't read that any place else.
Now I want you to take a look at a weekly chart for the April gold that goes back almost two years:
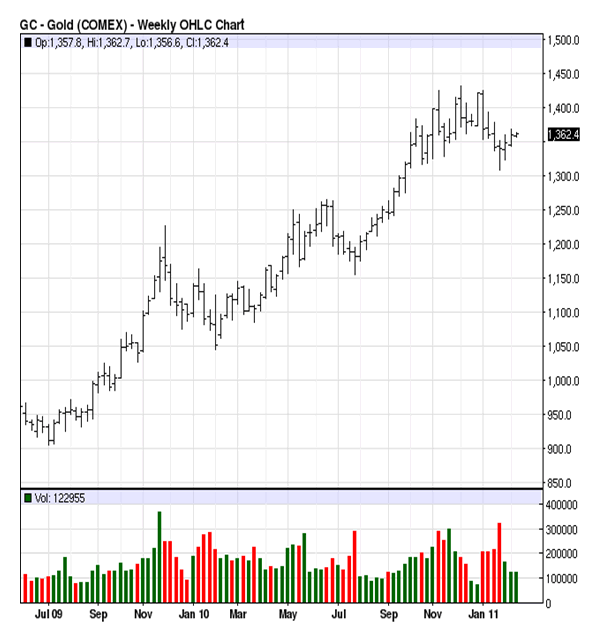
Here you can see that top and bottom bands of the ascending trend lines and you'll note that at no time has gold violated the bottom band. In other words the secondary trend has remained bullish at all times. What's more I have drawn in a line that shows gold breaking out yet again to the high side and gold's reaction used that line as support; another very bullish indicator for those with unbiased eyes willing to see.
Next I've posted a monthly chart for the same April gold futures contract:
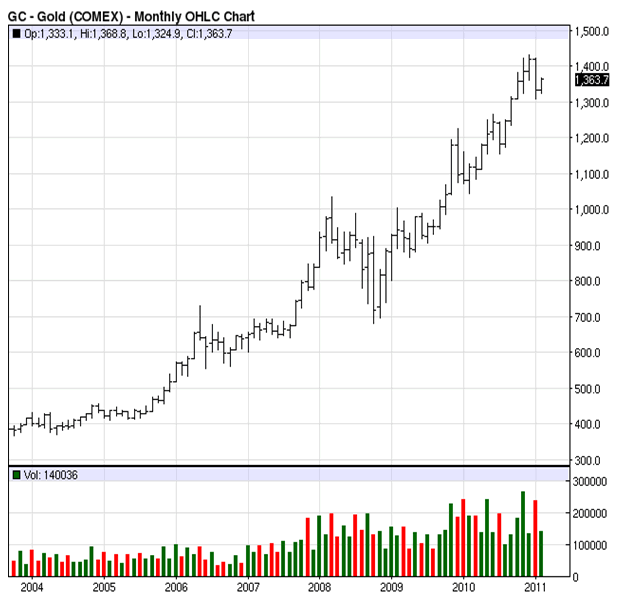
Here it is clear to see that the primary trend going back to is intact and the secondary trend higher that began in late 2008 is also intact. What's more there is an additional trend line that connects the two previous significant highs and with April gold trading at 1,365.00 today it is now back above that trend line.
Finally I want you to look at a chart posted in the Weekend Report that shows gold's "rounded top":
A rounded top will not be the end of the story
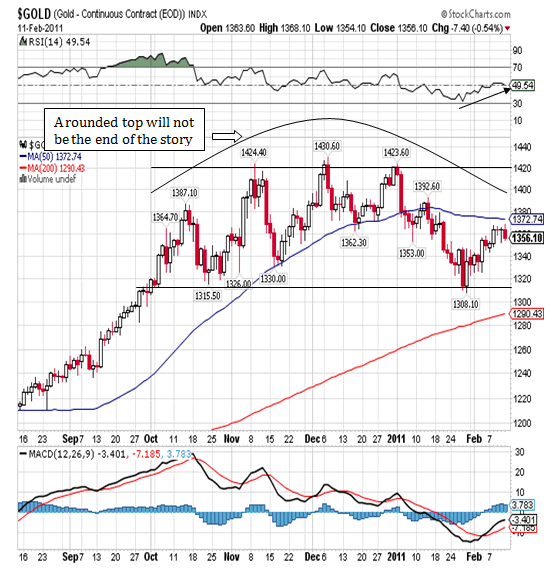
Note the series of marginally higher all-time closing highs and the rounded top. You can go back to the 1999 low of 252.50 that marked the beginning of the bull market and you will not find one single instance of gold forming anything even close to a significant high in such a manner. Gold always, without exception, has a big spike to the upside that leads to and exhaustion followed by a significant reversal in direction.
Given everything that I've said there is no doubt that gold will work itself up to yet another new closing all-time high and it will probably do so this month although that is just a timing guess on my part. The spot gold has significant Fibonacci resistance at 1,372.80 and again at 1,447.50 and we've been close to the latter on three separate occasions. Below I have posted a series of Fibonacci numbers, support as well as resistance, so that you can follow along:
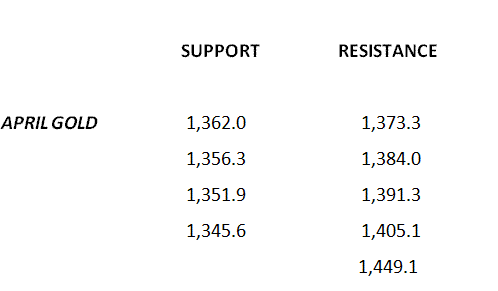
Once gold moves beyond 1,449.10 in the April contract, and I am convinced it will, there is nothing to stop it until it hits 1,522.20 and then it's good to go until 1,596.90. I am convinced that gold will rally to a minimum of 1,522.20 and could very well reach 1,600.00 and it will do so in a violent spike higher that will leave all of those waiting for a correction on the sidelines. That spike will produce and exhaustion and the exhaustion will be followed by a significant reaction of no less than 17.50% and no more than 25%. Then it's off to US $2,000.00 and beyond. Of course there could always be some external event that causes gold to explode to US $2,000.00 straight away and that's why I sit tight through any and all corrections. With gold you just never know!
Anthony J Stills Steve Betts
as@theablespeculator.com sb@theablespeculator.com
© 2011 Copyright Anthony J. Stills - All Rights Reserved
Disclaimer: The above is a matter of opinion provided for general information purposes only and is not intended as investment advice. Information and analysis above are derived from sources and utilising methods believed to be reliable, but we cannot accept responsibility for any losses you may incur as a result of this analysis. Individuals should consult with their personal financial advisors.
© 2005-2022 http://www.MarketOracle.co.uk - The Market Oracle is a FREE Daily Financial Markets Analysis & Forecasting online publication.


