An Objective Elliott Wave Study of S&P 500 Stocks Index
Stock-Markets / Elliott Wave Theory Feb 14, 2011 - 04:00 AM GMTBy: Piazzi
 Let’s look at some possible wave configurations
This is a bullish wave configuration that marks the 2009 low as the end of a Cycle 2 wave and all waves after that as parts of a Cycle 3 wave up
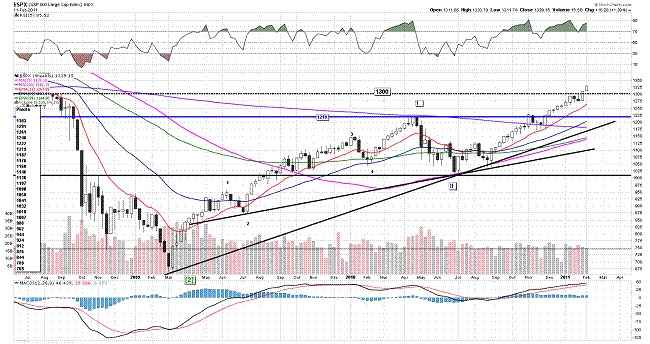
Within the framework of the above count, and using the tenets of Objective Elliott Wave (OEW), we have had 6 quantifiable waves complete from March 2009 to June 2010. We currently have a 7th wave unfolding from the low of June 2010
OEW observes all rules and guidelines of traditional Elliott Wave. In addition, OEW has proprietary rules that objectively determine the end of significant waves. Those set of rules are unique to OEW and remove the subjectivity of wave end determination for larger significant waves.
The objectively quantified waves that we have so far are
March 2009 – June 2009 (up)
June 2009 – July 2009 (down)
June 2009 – Jan 2010 (up)
Jan 2010 – Feb 2010 (down)
Feb 2010 – May 2010 (up)
May 2010 – June 2010 (down)
June 2010 – ongoing (up)
If the overall framework of the bullish count is correct, there are least two quantifiable waves to unfold. Under Elliott Wave, bullish counts are of a 5 +4n count where n can be any number starting from 0. So, bullish counts can be 5, 9, 13, 17, …. waves.
When the current wave that started from the low of June 2010 ends, it would mark the 7th wave up to be followed by an 8th wave down and, at the very least, by a 9th wave up.
These are the large waves that we can quantify using OEW rules
Within the context of the quantifiable waves, there are smaller waves whose ends are not marked by OEW reversal rules. There can be a number possible ways counting the internal waves of the ongoing wave from June 2010
This is the count I have been carrying frequently in recent posts
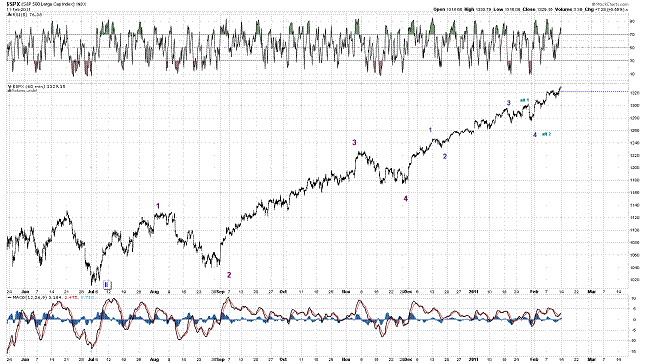
The above count is the most conservative count and is looking for an end to the current run in the days ahead.
This is another possibility
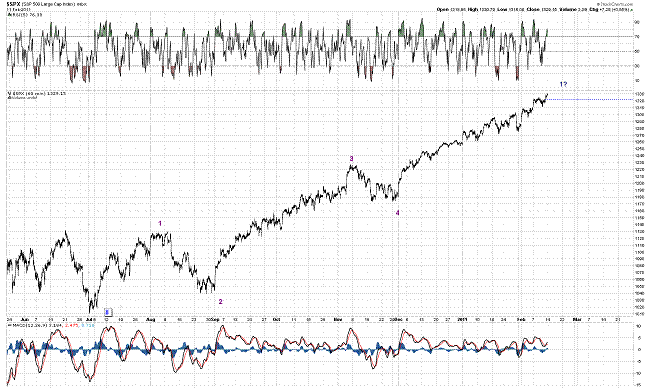
The above count examines the possibility of a wave extension within the context of the Intermediate (purple) wave 5 that started Dec 2010.
This an even more bullish possibility
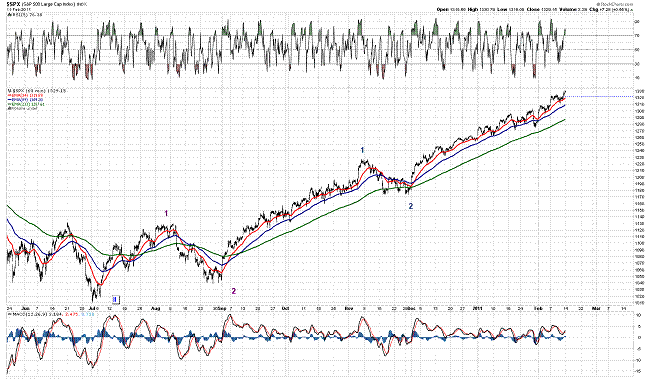
The above count examines the possibility of wave extension within the context of the Intermediate (purple) wave 3 that started Sep 2010.
This is another possibility
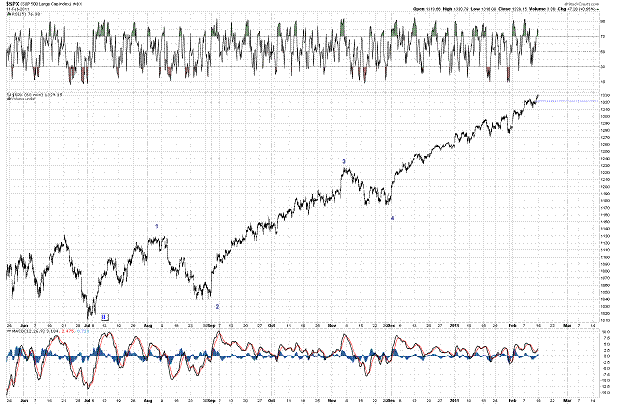
The above count downgrades the degree of smaller waves from Sep 2010 and examines the possibility of them being Minor (dark blue) degree waves
If you think this can be overwhelming, I agree with you. But it shows you how dangerous it can be if one does one wave configuration and sticks to it without examining other possibilities. It can even be harder for those who do not have any rules to let them determine the end point of significant waves.
To make it simpler, we need to await an OEW wave confirmation to the current wave that started June 2010. When we have that reversal confirmed by OEW, we will get the 8th wave down and it is that wave that can determine if the overall bullish count since March 2009 is correct or not.
Let me explain why
I believe that a wave analyst should always try to think of at least two opposing alternates, one bullish, and one bearish
This is a bearish alternate
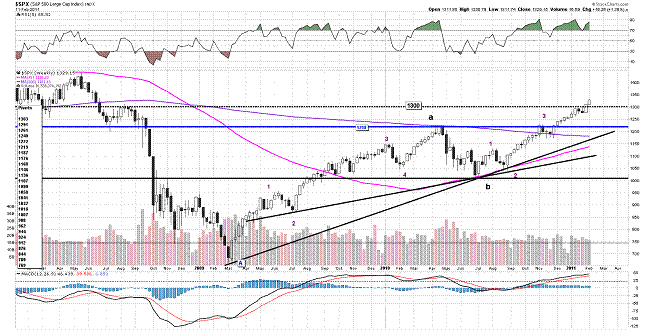
The above count examines the possibility of the entire rise from March 2009 being a counter trend corrective market rally.
Under Elliott Wave corrections can be wither a 5-wave triangle or a 3+4n wave structure where n can be any number starting from 0. So, corrective (counter trend) counts can be 3, 7, 11, …. waves.
The rise from March 2009 is not a triangle.
So, far we have 6 completes OEW waves, and a 7th wave unfolding as explained above.
If this is a bear market corrective rally, then this current wave may be the last (7th wave) of that rally. If so, when we get a reversal confirmation and start the 8th wave down, the top of the wave should be THE VERY TOP for a long time. Otherwise, either the bullish count will prevail, or an 11-wave correction can be examined, both of which indicate higher prices.
Sounds like too many variables, well, no one said it was be easy. Waves provide an elegant way to characterize and model price behavior. OEW provides rules to objectively quantify the end of significant waves and improve the model. But it is still a model.
George E. P. Box said: “All models are wrong but some are useful”
All analysis we do, be it technical or fundamental, is based on past data. That means that we study statistical certainty of the past to create a probabilistic model for the future. All models can and do break from time to time.
That is where risk analysis comes into play. An analyst must examine the scenarios that can make his model break, and that is why I think examining at least two opposing scenarios (one bullish, one bearish) is a prudent must.
Now, as long as the current wave that started June 2010 has not reversed or has not created a condition that would raise the possibility of a reversal, the trend is up. All there is to do for a trend follower is to evaluate risk within his time frame of choice and act accordingly (set stops, hedge, insure, whatever the individual’s risk-mitigation technique may be)
That, to me, is easier that constantly trying to pick tops (or bottoms if it’s a downtrend). That is how I understand and apply Bernard Baruch’s quote from the beginning of this writing
At Market Time Premium, I study the market and identify risk levels in multiple time frames. I approach and characterize the price behavior of the market from a larger time frame to smaller time frames. But, knowing that risk happens at the margin of smaller frames, I define potential change levels starting from smaller frames, and then examine the possibility of that change to propagate into larger time frames.
By Piazzi
http://markettime.blogspot.com/
http://markettime.wordpress.com/
I am a self taught market participant with more than 12 years of managing my own money. My main approach is to study macro level conditions affecting the markets, and then use technical analysis to either find opportunities or stay out of trouble. Staying out of trouble (a.k.a Loss) is more important to me than making profits. In addition to my self studies of the markets, I have studied Objective Elliott Wave (OEW) under tutorship of Tony Caldaro.
© 2011 Copyright Piazzi - All Rights Reserved Disclaimer: The above is a matter of opinion provided for general information purposes only and is not intended as investment advice. Information and analysis above are derived from sources and utilising methods believed to be reliable, but we cannot accept responsibility for any losses you may incur as a result of this analysis. Individuals should consult with their personal financial advisors.
© 2005-2022 http://www.MarketOracle.co.uk - The Market Oracle is a FREE Daily Financial Markets Analysis & Forecasting online publication.


