Stock Market Trends All Remain Up
Stock-Markets / Stock Markets 2011 Feb 13, 2011 - 06:36 PM GMTBy: Andre_Gratian
 Very Long-term trend - The continuing strength in the indices is causing me to question whether we are in a secular bear market, or two cyclical bull/bear cycles side by side. In any case, the very-long-term cycles are down and, if they make their lows when expected, there will be another steep and prolonged decline into 2014-15.
Long-term trend -In March 2009, the SPX began an upward move in the form of a mini bull market. Cycles point to a continuation of this trend for several more months.
SPX: Intermediate trend - The intermediate trend is still up and does not look in immediate danger of reversing. Recent action continues to point to the imminent formation of a short-term top.
Analysis of the short-term trend is done on a daily basis with the help of hourly charts. It is an important adjunct to the analysis of daily and weekly charts which discusses the course of longer market trends.
Long-term analysis:
Because of the potentially powerful long-term cycles which are slated to make their lows in three to four years, I thought that the decline which started in October 2007 would be the beginning of a secular bear market. However, the strength of the recovery since March 2009 is causing me to reconsider. It's possible that, instead of a seven or eight year bear market, we may be in the midst of two consecutive cyclical bull/bear markets. From a practical view point, the distinction does not really matter - except, perhaps, to academia.
With technical analysis, we study the forces of supply and demand whose continuing tug-of-war is responsible for all market trends. I recently came across this quote: "The beauty of technical analysis is that it's the collective visual representation of all market influences and elements - human emotions, earnings, geopolitics, manipulation, acts of god, the influence of the planets, and smoke signals if you like. If you see it there, it's legitimate. It is what it is." -- Brinkley, 7-17-2009.
I don't know who Brinkley is, but he surely has it right! Following only one discipline -- whether it be fundamental or technical -- is a short-sighted analytic process which carries the inherent risk of misconstruing the whole picture. Comprehensive technical analysis is the best approach.
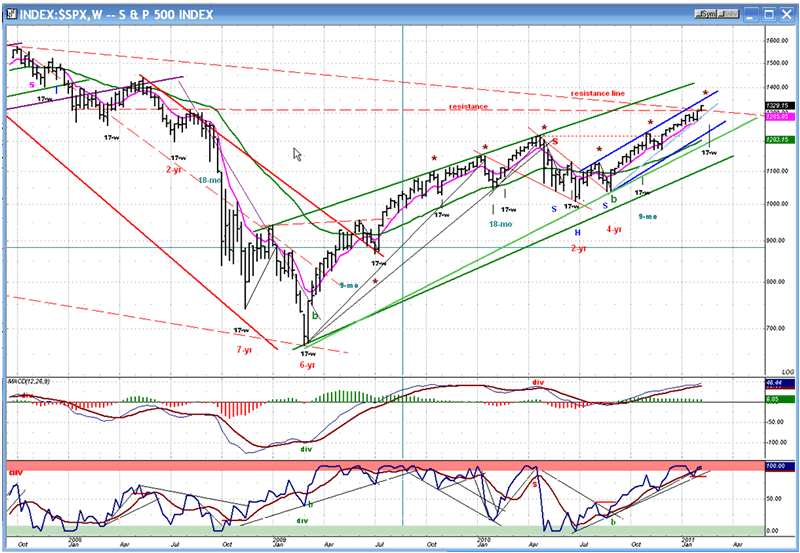
With this in mind, let's take a look at a Weekly log Chart of the SPX. There is no question that we are in a strong uptrend which shows no readiness to make a significant reversal. As long as prices remain confined to the dark green channel, we can safely assume that the bull market which started two years ago is intact.
Before a reversal occurs in an uptrend, there are usually signs that the supply/demand ratio is changing. On a chart, this shows up as deceleration. It can be observed in the price pattern itself, or with the help of momentum oscillators. For instance, if the current uptrend would end before rising to the channel top, we would have to conclude that some deceleration is taking place. But even if this were the case, we would probably still be a long way from ending the trend. Trend lines normally provide price support. In this case, the SPX would have to break three important trend lines before getting down to the lower channel line.
More likely to happen, there will shortly be a pause in the uptrend and, after an adequate period of consolidation, the uptrend can resume.
The lower indicator is overbought, but it has a reading of 100, which does not convey any deceleration in the trend which started in July and, although it is more than probable that we are due for a short-term correction, we don't have any reason to believe that it will be anything more than that. The resistance lines shown on the chart have not been surpassed decisively enough to signal that they are being ignored, and there are cyclical factors to consider that I will discuss when we analyze the next chart.
Short-term projections and analysis
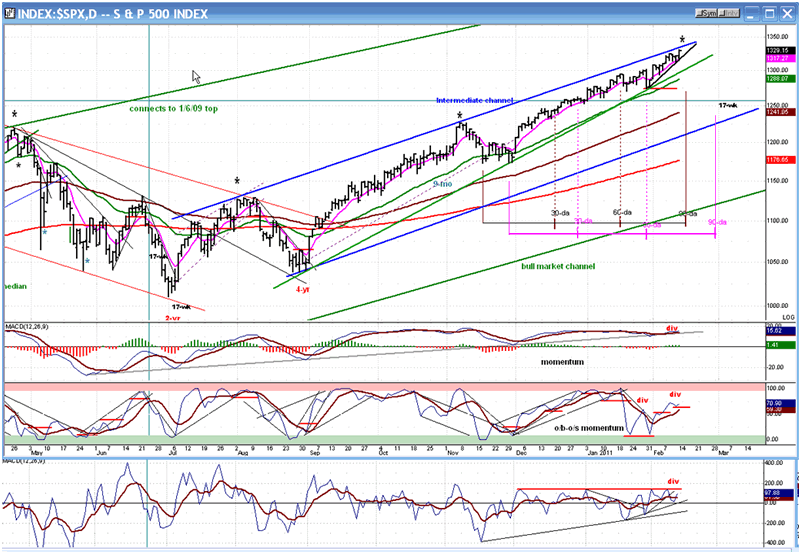
Let's now take a look at the Daily Chart. On this scale, also, there is nothing but evidence of strength. The trend has taken the index all the way to the top of its intermediate channel. BUT, there are many signs (once again) that a correction is about to take place.
First, the top channel line is likely to provide resistance. Next, even though there is no deceleration showing in the price pattern, there is negative divergence in all three indicators. Finally, we are coming into the area of several short-term cycles. The most immediate one is marked on the chart with a brown asterisk. Although it existed - but was less noticeable before the March 2009 low -- this 68-trading day rhythm has been very regular since then. The next one was/is due Friday or Monday.
The others will be discussed under "Cycles". I have learned to take short-term cycles with a grain of salt, especially those that could indicate highs or lows, but they are an aspect of the total picture that should not be ignored, issuing warnings that trend changes could be taking place.
The Point & Figure chart is one of the most valuable tools in the technical analysis kit, and one which could probably stand on its own. We'll now turn to the Hourly Chart to look at the P&F projection established by the latest minor consolidation area, as well as some near-term indicator fine-tuning.
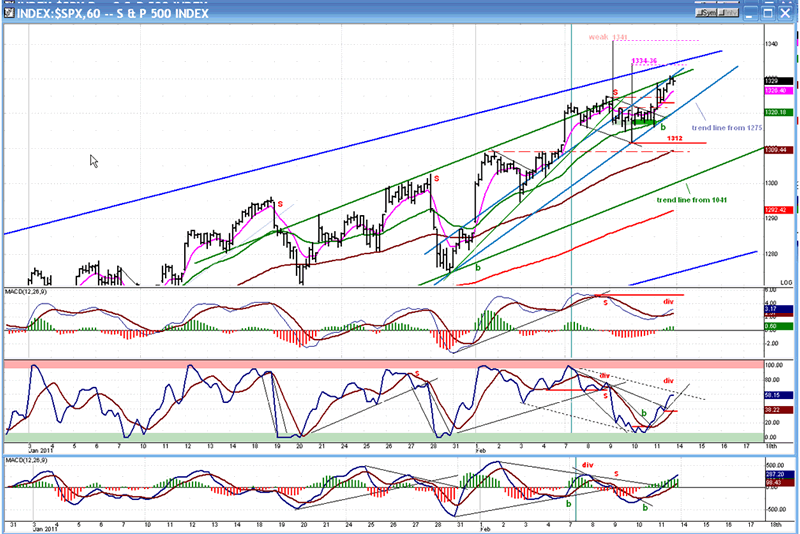
I am only showing the last phase of the advance because this is the part of the uptrend that I want to put in focus. First, let's get oriented. The blue channel is the top half of the intermediate channel from 1041. The green trend line is the short-term trend line from 1041. When broken, it will signal an interruption in that trend, but not necessarily its end. Because it is still very steep and there is no deceleration evident in the intermediate trend, another short-term trend line may form at a lesser angle which, when broken, will give us a more convincing sell signal for the intermediate trend. I have drawn a parallel of the short-term trend line across several tops. It appears to be providing resistance since it has stopped the advance several times over the past month.
There is also a shorter-term trend line in light blue which starts at 1275. I have drawn a parallel to that trend line, as well, across the first minor top of that uptrend. Note that on Friday, the advance stopped where it intersects with the green parallel.
The last consolidation level formed a small base before the break-out. On the P&F chart, that base translates into two potential projections. A count taken from the low point to the break-out gives us a target of 1334-1336. If we extend the base to include the left side of the low point, we come up with 1041. As I have noted on the chart, this is a weak count which could be attained only if this move gathers strength. We can keep it in the back of our minds, but not count too much on it.
Of the two potential targets, the correct one will be revealed by the market action after it has been reached. When the index breaks the trend line from 1275, and goes on to trade below 1312, we will know that that phase of the uptrend has ended and that we can probably expect a challenge of the trend line from 1041. And if that one is broken, etc. etc....
The market reveals itself phase by phase, each one carrying clues about what should follow. Considering the condition of the hourly indicators, it is possible that the high point could have come on Friday, at 1330.79. The momentum indicators are showing strong negative divergence. The breadth oscillator, however, is not as weak and is perhaps telling us that the move is not over.
As of Friday's close, we do not have a sell signal. When all three indicators turn down and cross over, it will be the time to look for a potential break of the light blue trend line, and perhaps of the green one as well.
Cycles
I have already pointed out the potential 68-day rhythm which could bring a top in this time frame.
There is also a 90-calendar day cycle which is due in two more days, and another 90/180-day from another phase which is due on 2/28. Since that date coincides with a 17-wk low, it should be a good time for a market low.
Breadth
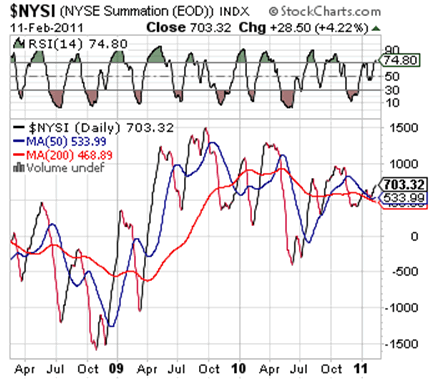
There has been little movement in the NYSE Summation Index (courtesy of StockCharts.com) since the late November low and it is still in an uptrend -- but showing negative divergence to the SPX price which continues to warn of an impending top. This is consistent with the current market condition and other indicator signals.
Sentiment
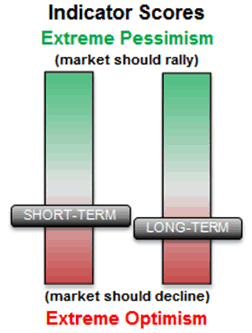
The SentimenTrader (courtesy of same) is also consistent with the other indicators, which suggests that a short-term reversal is near. It has become more bearish over the past couple of weeks, both in the short and long term.
Dollar index
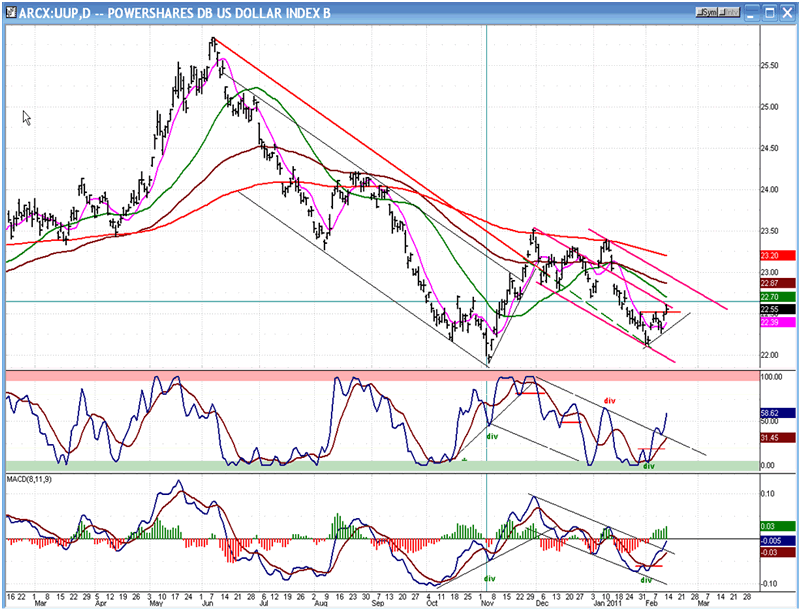
The following is the Daily Chart of UUP, the dollar ETF. The substantial decline from June 2010 was arrested in early November and was followed by a rally which broke out of the downtrend channel, but could not rise beyond the 200-DMA. In early February 2011 the November low was successfully re-tested and a short-term uptrend started.
Last Friday, it reached the mid-point of its correction channel -- a level where it could find some temporary resistance. But the momentum indicators are in strong uptrends and suggest that the rally has farther to go -- probably to test the top trend line of the down-channel.
The bigger picture looks as if it is in the process of building a large base from which it will break out when it can get past the 200-DMA. This may take several more weeks and, until then, its effect on the equity indices will be minimal.
Gold
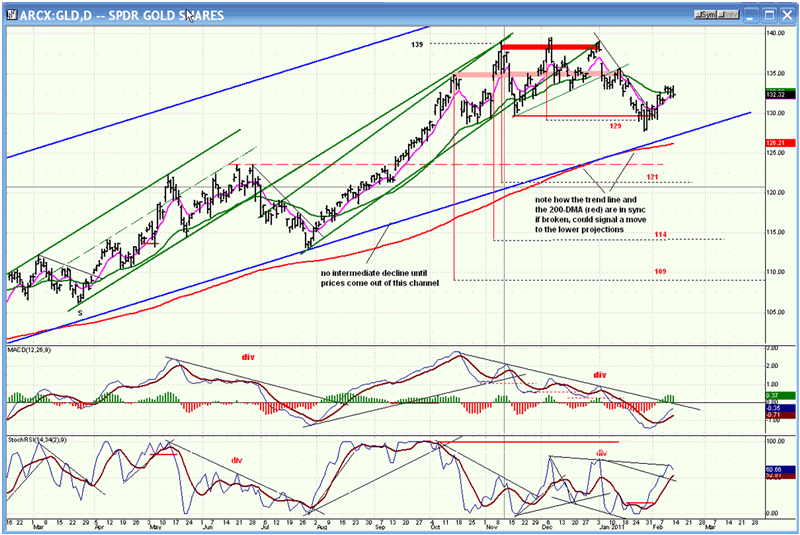
GLD continues to progress as anticipated. After declining slightly beyond its initial target of 129, it has formed a consolidation area and started a counter-trend rally which, according to the Point & Figure chart, could continue until it reaches 134/135 before potentially resuming its decline toward the lower projection targets.
Because of the proximity of an important trend line and its 200-DMA which should provide strong support when touched, GLD may continue trading above 128 and expand its consolidation area, or extend its correction. If it chooses to do the latter, it may be in for a long intermediate decline down to the lower projection of 114, and perhaps even 109. The odds of resuming its long-term uptrend right away are not very high.
The daily chart indicators are still in an uptrend suggesting that the 134-35 target for the counter-trend rally has a good chance of being met. The Weekly chart indicators are not as bullish. The MSO has reached oversold but has barely started to turn, looking as if it may be several weeks away from getting back in an uptrend. The MACD continues to decline, but it is still in positive territory and, the lack of negative divergence at the last top may be suggesting that the immediate correction will not be that severe.
Of course, the fate of gold is closely connected to that of the dollar, and as long as the dollar is not ready to start a major move, gold will probably not start a significant correction.
SUMMARY
All trends are still up. The short-term trend cried wolf several times about making a top, and then continued on its merry way.
It is doing so again, but until it decisively breaks its trend line from 1041 (which is currently running at about 1300), it will just be another false alert.
FREE TRIAL SUBSCRIPTON
If precision in market timing for all time frames is something which is important to you, you should consider a trial subscription to my service. It is free, and you will have four weeks to evaluate its worth.
For a FREE 4-week trial. Send an email to: ajg@cybertrails.com
For further subscription options, payment plans, and for important general information, I encourage you to visit my website at www.marketurningpoints.com. It contains summaries of my background, my investment and trading strategies and my unique method of intra-day communication with Market Turning Points subscribers.
By Andre Gratian
MarketTurningPoints.com
A market advisory service should be evaluated on the basis of its forecasting accuracy and cost. At $25.00 per month, this service is probably the best all-around value. Two areas of analysis that are unmatched anywhere else -- cycles (from 2.5-wk to 18-years and longer) and accurate, coordinated Point & Figure and Fibonacci projections -- are combined with other methodologies to bring you weekly reports and frequent daily updates.
“By the Law of Periodical Repetition, everything which has happened once must happen again, and again, and again -- and not capriciously, but at regular periods, and each thing in its own period, not another’s, and each obeying its own law … The same Nature which delights in periodical repetition in the sky is the Nature which orders the affairs of the earth. Let us not underrate the value of that hint.” -- Mark Twain
You may also want to visit the Market Turning Points website to familiarize yourself with my philosophy and strategy.www.marketurningpoints.com
Disclaimer - The above comments about the financial markets are based purely on what I consider to be sound technical analysis principles uncompromised by fundamental considerations. They represent my own opinion and are not meant to be construed as trading or investment advice, but are offered as an analytical point of view which might be of interest to those who follow stock market cycles and technical analysis.
Andre Gratian Archive |
© 2005-2022 http://www.MarketOracle.co.uk - The Market Oracle is a FREE Daily Financial Markets Analysis & Forecasting online publication.


