


Gold Fails to Respond to Middle East Crisis, Looks Ready for More Downside Action
Commodities / Gold and Silver 2011 Feb 13, 2011 - 09:45 AM GMTBy: Merv_Burak

 The upheaval in the Middle East has done nothing for gold. It looks like gold is ready for more downside action. A move to $1305 would not be good. The “Penny Arcade Index” is still okay so any downside activity shouldn’t last for too long.
GOLD : LONG TERM
First, the P&F chart. As mentioned previously, it had given me a bear signal but there was still a support at the $1320 mark to be overcome before really going bearish. This requires, on the P&F chart, a move to the $1305 level, which the price has not yet met. So, we are in limbo for now. A move to the $1305 level would also cross below the long term moving average line and turn the line downward further confirming the bear, at that time. So, we wait.
Looking at the usual indicators, the price of gold remains above the long term moving average line. The line itself is still in an upward slope but is turning towards the horizontal ready to turn down on the slightest provocation. The long term momentum indicator continues in its positive zone and is once more above its now positive trigger line. However, weakness is shown in that it just can’t seem to get any significant upward trend going. The volume indicator seems to have topped out and is in a basic lateral drift. It continues to move above and below its trigger line in the process. It is below the trigger on Friday however, the trigger is still very, very slightly in a positive slope. All in all the long term rating still remains BULLISH.
INTERMEDIATE TERM
On the intermediate term we have a somewhat less favorable story. Gold continues to track below its negative sloping moving average line. The intermediate term momentum indicator has now moved above its neutral line into the positive zone and above a positive trigger line. As for the volume indicator, it continues to be basically below its trigger line and the trigger remains in a negative slope. On the intermediate term the rating is only at the – NEUTRAL level, one step above a full bear. The short term moving average line, although moving upwards, is still below the intermediate term line for a negative reading and confirmation of the negative rating.
SHORT TERM
Although it looks like we are in a short up trend it also looks like a topping activity getting ready for some more down side action. A drop below $1350 would put us into such a negative phase. For now gold price remains above its short term moving average line and the line slope remains upward. The momentum indicator is just very slightly above its neutral line and above its positive trigger line but that could change with another negative day of activity. The daily volume action is still pretty low and below its average volume over the past 15 days. For now the rating remains BULLISH with the very short term moving average line confirming.
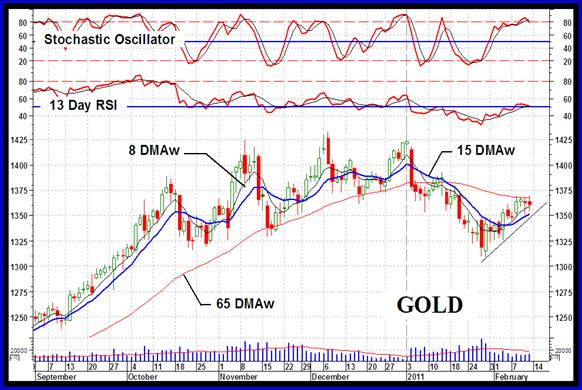
As for the immediate direction of least resistance, I’m going with the down side for Monday. The past two days have been negative days and the Stochastic Oscillator has just dropped below its overbought line and below its trigger line and seems to be heading lower.
SILVER
Silver has out performed gold this past week and just about made it into new high territory but stumbled and is getting ready for more down side action. A little bit of positive view is the fact that although the last two days were negative days for silver, the price each day seems to have rebounded significantly from the day’s lows and appears not to want to go lower. So, maybe the downside is not in the works but only a very short rest.
For today everything is still on the plus side. For the long term silver is still in no danger from any reversal so the rating remains BULLISH.
On the intermediate term everything is also positive with silver above its positive moving average line and the momentum indicator in its positive zone above its positive trigger line. The volume indicator is slightly above its trigger line although the trigger is still pointing downward. In all, the indicators suggest the intermediate term rating is BULLISH. The short term moving average line has just crossed above the intermediate term line for confirmation.
On the short term the trend is still in a positive direction BUT it does seem to be topping out. We do have a slight up trending short term wedge pattern that was broken to the down side on Friday. A short term up trend in the momentum indicator was broken the day before. However, as of the Friday close we are still in positive territory. The price of silver remains above its positive sloping moving average line and the short term momentum indicator remains in its positive zone. The indicator has, however, turned to the down side and is sitting right on top of its trigger line. The daily volume activity is still pretty low and not helping. It is slightly below its average volume over the past 15 days. Still, with everything considered the short term rating remains BULLISH with the very short term moving average line confirming.
PRECIOUS METAL STOCKS
I had been asked by many viewers to post my Composite Index of Precious Metals Indices more often, so here it is today.
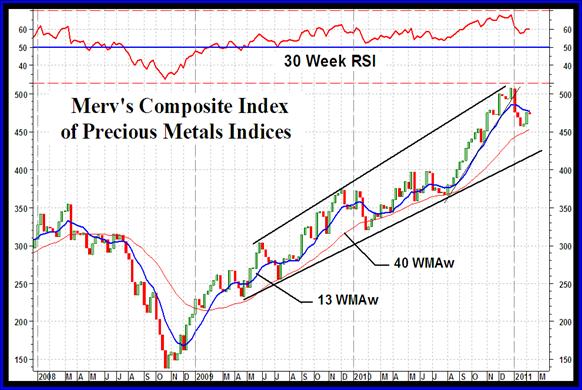
The Composite Index is, of course, based upon the average weekly performance of all the components of the Table posted here each week. There are a few interesting features shown on the chart. We have a slight expanding wedge pattern (commonly referred to as a megaphone pattern). This pattern, once well established, is not a positive pattern and usually suggests a volatile weakness in the price activity. Too often it ends up with the price moving to lower levels, breaking the lower support line. For now we see the recent Index price hitting the upper resistance line and reacting. Now the question is, how low will it go? Although difficult to see, we did have a sharp up trend line from the August low which was broken on the first week of January. Going over to the long term momentum we see that it is still comfortably, for now, within its positive zone and more importantly, the recent January top did not give us a negative divergence so the move was still quite positive.
I wouldn’t go into performing a ratings review on the Composite. I think it’s more important to rate the individual Indices and especially the particular sector (see the Merv’s Indices) of the precious metals one is interested in.
Merv’s Precious Metals Indices Table
Well, that’s it for this week. Comments are always welcome and should be addressed to mervburak@gmail.com.
By Merv Burak, CMT
Hudson Aero/Systems Inc.
Technical Information Group
for Merv's Precious Metals Central
For DAILY Uranium stock commentary and WEEKLY Uranium market update check out my new Technically Uranium with Merv blog at http://techuranium.blogspot.com .
During the day Merv practices his engineering profession as a Consulting Aerospace Engineer. Once the sun goes down and night descends upon the earth Merv dons his other hat as a Chartered Market Technician ( CMT ) and tries to decipher what's going on in the securities markets. As an underground surveyor in the gold mines of Canada 's Northwest Territories in his youth, Merv has a soft spot for the gold industry and has developed several Gold Indices reflecting different aspects of the industry. As a basically lazy individual Merv's driving focus is to KEEP IT SIMPLE .
To find out more about Merv's various Gold Indices and component stocks, please visit http://preciousmetalscentral.com . There you will find samples of the Indices and their component stocks plus other publications of interest to gold investors.
Before you invest, Always check your market timing with a Qualified Professional Market Technician
Merv Burak Archive |
© 2005-2022 http://www.MarketOracle.co.uk - The Market Oracle is a FREE Daily Financial Markets Analysis & Forecasting online publication.