


Stock Market Uptrend is Relentless, Analysis for Week Starting 14th Feb
Stock-Markets / Stock Markets 2011 Feb 12, 2011 - 09:57 AM GMTBy: Tony_Caldaro

 Economic reports continue to come in mostly on the positive side and the market continues to move higher. This week the positive economic reports again outnumbered negative reports 8 to 2. On the negative side both the Trade and Budget deficits worsened. On the positive side consumer credit, wholesale inventories, consumer sentiment, the monetary base, the WLEI, excess reserves and the leading wbase increased. Also, jobless claims declined.
The market responded by continuing its seven month uptrend and making new highs. For the week the SPX/DOW were +1.45%, and the NDX/NAZ were +1.65%. Asian markets lost 0.9%, European markets gained 0.9%, the Commodity equity group lost 0.6%, and the DJ World index rose 0.2%. Bonds were -0.1%, Crude lost 2.7%, Gold was +0.5%, and the USD rose 0.5%. Friday night the FED released the following: http://www.federalreserve.gov/.... Next week will be highlighted by Retail sales, the PPI/CPI, Housing and Options expiration.
LONG TERM: bull market
The bull market continued this week as the SPX, as well as, the DOW/NAZ/NDX all made new bull market highs. In fact, the NDX continues to rise above its 2007 high, and the NAZ is only 1.8% below its 2007 high. The long term bull market count remains the same: five Major waves completed Primary wave I in Apr10 at SPX 1220, Primary wave II ended in July10 at SPX 1011, and Primary wave III has been underway ever since.
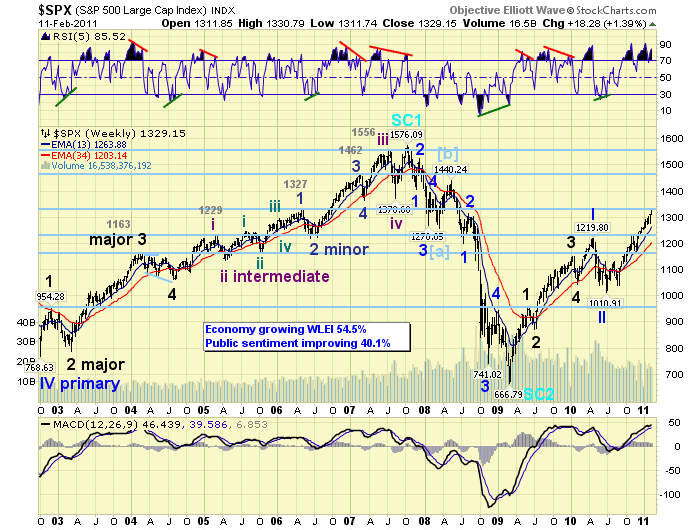
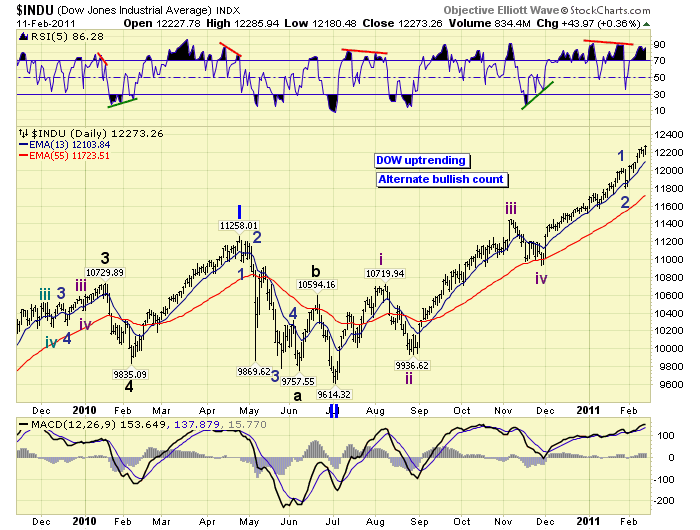
While Primary I divided into five Major waves, each lasting between one and six months, the first uptrend of Primary wave III has exceeded all five of those waves in time and price. Thus far this uptrend is seven months long and has risen 320 SPX points. The previous longest uptrend was 289 SPX points. This market strength offers several potential counts, medium term, going forward. We had posted two more bullish counts on the DOW/NDX daily charts. We opted for the more conservative of these three counts on the SPX charts. The current SPX count, however, will be eliminated if the SPX exceeds 1334. Then the DOW count would be the main count with the NDX count the alternate.
MEDIUM TERM: new uptrend high at SPX 1331
As noted above this lengthy uptrend began at the July10 SPX 1011 low. As the uptrend unfolded we identified seven important waves. An Aug10 high and low at SPX 1129 and 1040 respectively, a Nov10 high and low at SPX 1227 and 1173 respectively, a Jan11 high and low at SPX 1303 and 1275 respectively, and the current rally from that low. The first two pullbacks (1040 and 1173) took about three weeks each. This last pullback (1275) took only one day. This suggests the first two pullbacks were of a higher degree than the most recent one. And, this is the reason we prefer the DOW alternate count over the NDX alternate count, should SPX 1334 be exceeded. These seven waves also suggest this uptrend has further to go, as waves eight (pullback) and nine (rally) have yet to unfold. Extended uptrends are obviously somewhat difficult to track as larger waves continue to subdivide into smaller waves.
We now also observe another OEW pivot/Fibonacci resistance cluster ahead. Currently there is little resistance been the 1313 support pivot and the 1363 resistance pivot. There is a cluster of fibonacci relationships around the 1363 pivot. First, Intermediate wave five equals Int. wave three at SPX 1360. Second, Int. wave five equals 1.618 times Int. wave one at SPX 1364. This suggests this price level will be quite difficult to overcome, just as the recent OEW pivot (1291-1313)/Fibonacci resistance cluster (1289-1306) offered quite a bit of resistance.
Market internals remain positive. All nine of the SPX sectors remain in confirmed uptrends with many of the other indices making new highs. The monthly RSI/MACD continues to rise, the weekly RSI is diverging but the MACD continues to rise, and the same for the daily RSI/MACD. Market breadth remains strong while making new highs. It has been uptrending since July10 as well. In addition, the vast majority of the foreign markets we track remain in uptrends: 11 of 15. The alternate DOW count is rising in probably.
SHORT TERM
Support for the SPX remains at 1313 and then 1303, with resistance at 1363 and then 1372. Short term momentum is slightly overbought. The unique feature of the rally from the Intermediate wave four Nov10 low at SPX 1173 is how moderate the pullbacks have been. Thus far this rally has had only nine pullbacks over 10 points, and all but two have been under 20 points. For a market to rally 13.5% with only two 2% pullbacks along the way is quite remarkable. This week we experienced another of the smaller pullbacks (13 points) after the uptrend made new highs at SPX 1325. And again, the market rallied to new highs at SPX 1331 to end the week. The key level to observe heading into next week is SPX 1334. A rise above this level eliminates the current SPX short term count, and moves the DOW alternate count to the forefront. Best to your trading!
FOREIGN MARKETS
Asian markets were mixed on the week for a lost of 0.9%. Three of the five we track; India’s BSE, Hong Kong’s HSI and China’s SSEC are in downtrends.
European markets were mostly higher on the week for a gain of 0.9%. None of the five indices were track are in downtrends.
The Commodity equity group was mostly lower on the week for a net loss of 0.6%. Only Brazils’s BVSP is in a downtrend while the other two keep uptrending.
The DJ World index gained 0.2% and remains in an uptrend.
COMMODITIES
Bonds lost 0.1% for the week but remain under the selling pressure of a downtrend. 10YR yields hit 3.74% mid week.
Crude lost 2.7% and is threatening to enter another downtrend. This market remains quite volatile.
Gold gained 0.5% on the week and is trying to confirm a new uptrend. Silver came close earlier in the week but pulled back for the last three days.
The USD gained 0.5% on the week and is also trying to confirm an uptrend after a DXY 76.88 low over a week ago.
NEXT WEEK
A busy economic week kicks off on tuesday with Retail sales, the NY FED, Import/Export prices, Business inventories and the NAHB housing index. On wednesday we have Housing starts, Building permits, the PPI, Industrial production, and the FED FOMC minutes. Then thursday weekly Jobless claims, the CPI, BEA leading indicators, and the Philly FED. Friday is Options expiration. On thursday FED chairman Bernanke gives Senate testimony, then on friday the chairman gives a speech in France on global imbalances and financial stability. There should be quite an interesting end to this trading week. Best to you and yours!
CHARTS: http://stockcharts.com/def/servlet/Favorites.CServlet?obj=ID1606987
http://caldaroew.spaces.live.com
After about 40 years of investing in the markets one learns that the markets are constantly changing, not only in price, but in what drives the markets. In the 1960s, the Nifty Fifty were the leaders of the stock market. In the 1970s, stock selection using Technical Analysis was important, as the market stayed with a trading range for the entire decade. In the 1980s, the market finally broke out of it doldrums, as the DOW broke through 1100 in 1982, and launched the greatest bull market on record.
Sharing is an important aspect of a life. Over 100 people have joined our group, from all walks of life, covering twenty three countries across the globe. It's been the most fun I have ever had in the market. Sharing uncommon knowledge, with investors. In hope of aiding them in finding their financial independence.
Copyright © 2011 Tony Caldaro - All Rights Reserved Disclaimer: The above is a matter of opinion provided for general information purposes only and is not intended as investment advice. Information and analysis above are derived from sources and utilising methods believed to be reliable, but we cannot accept responsibility for any losses you may incur as a result of this analysis. Individuals should consult with their personal financial advisors.
© 2005-2022 http://www.MarketOracle.co.uk - The Market Oracle is a FREE Daily Financial Markets Analysis & Forecasting online publication.