Want to Bet Against Permanent Open Market Operations (POMO) ?
Stock-Markets / Stock Markets 2011 Feb 11, 2011 - 09:08 AM GMTBy: John_Hampson

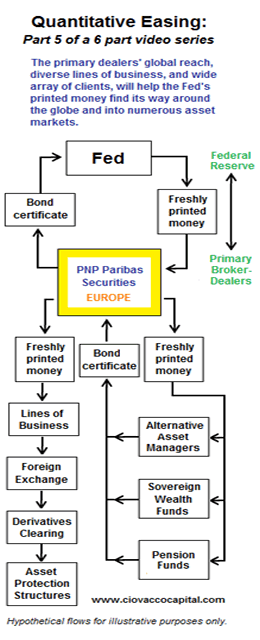
 Permanent Open Market Operations are purchases of treasuries and other securities by the Fed to inject money into the system. It is the policy of Quantitative Easing broken down into a schedule of action. Chris Ciovacco's diagram here shows how this policy results in pushing asset prices higher around the globe:

Source: ciovaccocapital.com
Quantitative Easing in the US is currently scheduled to continue into June 2011, and the latest schedule of POMO has just been announced, taking us from Feb 11th through to March 9th 2011:
http://www.newyorkfed.org/markets/tot_operation_schedule.html
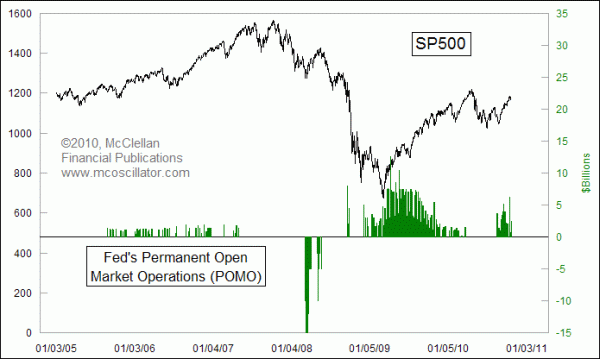
A total of $97 billion, which is slightly less than the last schedule of around $112 billion, but nevertheless a fairly potent average of around $6 billion a day. Take a look at what $6 billion a day can do:

Source: mcoscillator.com
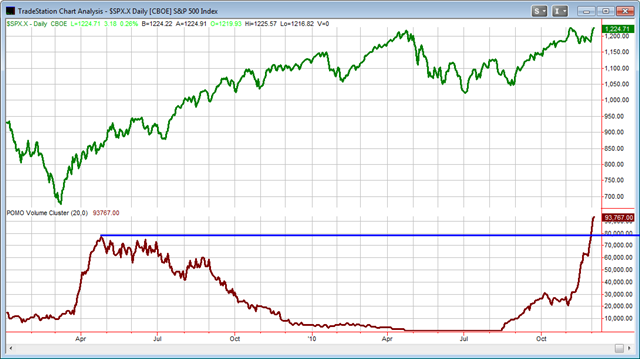
The period of steady injection of around $6 billion a day in 2009 played a key role in the stock market rally from March 2009 onwards. Similarly, the withdrawal of liquidity in 2008 most likely assisted stock market declines. Fast forward to QE2 and our current pomo injections can be held partially accountable for the current extended stock market rally in the face of persistent overbought indicators and sentiment.

Source: Quantifiable Edges blogspot
Until POMO and QE are signifcantly reduced or brought to an end then we are experiencing daily buying support for assets in general, as the new money permeates everywhere.
But it's not just QE. Homing in on US stocks, there are other tailwinds too:
Leading indicators are positive and stable
Money supply growing, money velocity stable
Bull market sustainablity index positive up to 1 year out
Financial conditions index positive
Latest earnings season has delivered a beat rate in excess of the last 3 quarters
Stocks are cheap relative to bonds historically
Stocks are in a presidential cycle sweetspot
In terms of headwinds:
Overbought indicators and sentiment
Some negative divergences
Retail investors now making positive domestic inflows (historically contrarian)
Certain P/es are now in excess of 100
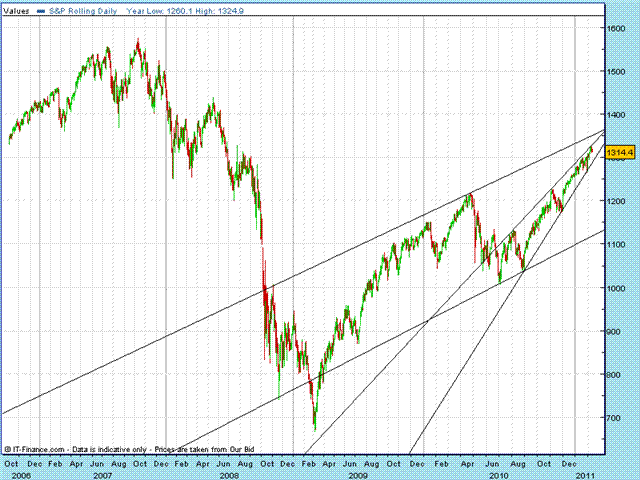
Weighed up, the tailwinds overpower the headwinds. For the SP500 index a push on to 1350 looks probable, and a continued cyclical bull into mid-year. If the negative seasonality of the second half of February delivers any significant pullback, I would be a buyer.

John Hampson
John Hampson, UK / Self-taught full-time trading at the global macro level / Future Studies
www.amalgamator.co.uk / Forecasting By Amalgamation / Site launch 1st Feb 2011
© 2011 Copyright John Hampson - All Rights Reserved
Disclaimer: The above is a matter of opinion provided for general information purposes only and is not intended as investment advice. Information and analysis above are derived from sources and utilising methods believed to be reliable, but we cannot accept responsibility for any losses you may incur as a result of this analysis. Individuals should consult with their personal financial advisors.
© 2005-2022 http://www.MarketOracle.co.uk - The Market Oracle is a FREE Daily Financial Markets Analysis & Forecasting online publication.


