


What Happens in a Sideways Stock Market
Stock-Markets / Stock Markets 2011 Feb 08, 2011 - 03:58 AM GMTBy: John_Mauldin

 Today's OTB features an excerpt from my friend Vitaliy Katsenelson's recently published The Little Book of Sideways Markets. Vitaliy is CIO at Investment Management Associates, a value investment firm in Denver, and he is a prolific and engaging writer (you can find and subscribe to his articles at http://ContrarianEdge.com). I had the pleasure of writing the foreword to Vitaliy's book, and here is a brief excerpt:
"Markets go from long periods of appreciation to long periods of stagnation. These cycles last on average 17 years. If you bought an index in the United States in 1966, it was 1982 before you saw a new high – that was the last secular sideways market in the United States (until the current one). Investing in that market was difficult, to say the least. But buying in the beginning of the next secular bull market in 1982 and holding until 1999 saw an almost 13 times return. Investing was simple, and the rising markets made geniuses out of many investors and investment professionals.
"Since early 2000, markets in much of the developed world have basically been down to flat. Once again, we are in a difficult period. Genius is in short supply.
" 'But why?' I am often asked. Why don't markets just continue to go up, as so many pundits say that "over the long term" they do? I agree that over the very long term markets do go up. And therein is the problem: Most people are not in the market for that long – 40 to 90 years. Maybe it's the human desire to live forever that has many focused on that super-long-term market performance that looks so good.
"In the meantime, we are in a market environment where investors have to be more actively engaged in their investments than before during a bull market when the rising tide lifted all ships. The Little Book of Sideways Markets is a life preserver that will help you navigate these perilous waters. Wear it well and wisely."
In the excerpt that follows, Vitaliy explains the whys and wherefores of bull, bear, and sideways markets.
John Mauldin, Editor
Outside the Box
A Sideways View of the World
by Vitaliy Katsenelson
What Happens in a Sideways Market
MOST PEOPLE (MYSELF INCLUDED) find discussions about stock markets a bit esoteric; for us, it is a lot easier to relate to individual stocks. Since a stock market is just a collection of individual stocks, let's take a look at a very typical sideways stock first: Wal-Mart. It will give us insight into what takes place in a sideways market (see Exhibit 2.1).
Exhibit 2.1 Wal-Mart, Typical Sideways Market Stock
Though its shareholders experienced plenty of volatility over the past 10 years, the stock has gone nowhere – it fell prey to a cowardly lion. Over the last decade Wal-Mart's earnings almost tripled from $1.25 per share to $3.42, growing at an impressive rate of 11.8 percent a year. This doesn't look like a stagnant, failing company; in fact, it's quite an impressive performance for a company whose sales are approaching half a trillion dollars. However, its stock chart led you to believe otherwise. The culprit responsible for this unexciting performance was valuation – the P/E – which declined from 45 to 13.7, or about 12.4 percent a year. The stock has not gone anywhere, as all the benefits from earnings growth were canceled out by a declining P/E. Even though revenues more than doubled and earnings almost tripled, all of the return for shareholders of this terrific company came from dividends, which did not amount to much.
This is exactly what we see in the broader stock market, which is comprised of a large number of companies whose stock prices have gone and will go nowhere in a sideways market.
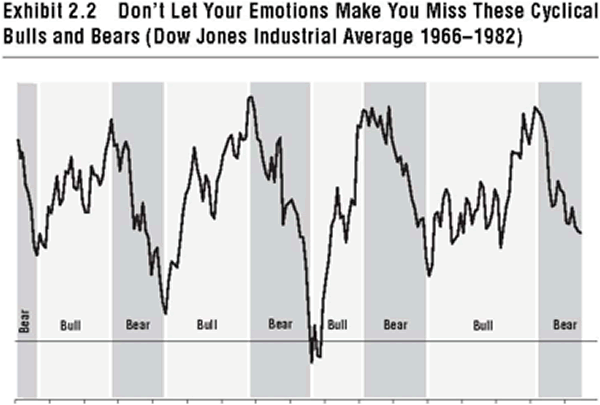
Let's zero in on the last sideways market the United States saw, from 1966 to 1982. Earnings grew about 6.6 percent a year, while P/Es declined 4.2 percent; thus stock prices went up roughly 2.2 percent a year. As you can see in Exhibit 2.2, a secular sideways market is full of little (cyclical) bull and bear markets. The 1966–1982 market had five cyclical bull and five cyclical bear markets.
This is what happens in sideways markets: Two forces work against each other. The benefits of earnings growth are wiped out by P/E compression (the staple of sideways markets); stocks don't go anywhere for a long time, with plenty of (cyclical) volatility, while you patiently collect your dividends, which are meager in today's environment.
A quick glimpse at the current sideways market shows a similar picture: P/Es declined from 30 to 19, a rate of 4.6 percent a year, while earnings grew 2.4 percent. This explains why we are now pretty much where we were in 2000.
Bulls, Bears, and Cowardly Lions – Oh My
Exhibit 2.3 describes economic conditions and starting P/Es required for each market cycle. Historically, earnings growth, though it fluctuated in the short term, was very similar to the growth of the economy (GDP), averaging about 5 percent a year. If the market's P/E did not change and always remained at its average of 15, then we would not have bull or sideways market cycles – we' d have no secular market cycles, period! Stock prices would go up with earnings growth, which would fluctuate due to normal economic cyclicality but would average about 5 percent, and investors would collect an additional approximately 4 percent in dividends. That is what would happen in a utopian world where people are completely rational and unemotional. But as Yoda might have put it, the utopian world is not, and people rational are not.
Exhibit 2.3 Economic Growth + Starting P/E =
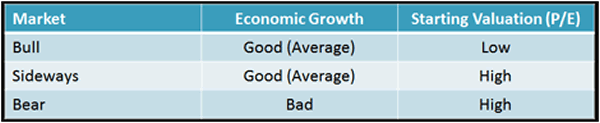
The P/E journey from one extreme to the other is completely responsible for sideways and bull markets: P/E ascent from low to high causes bull markets, and P/E descent from high to low is responsible for the roller-coaster ride of sideways markets.
Bear markets happened when you had two conditions in place, a high starting P/E and prolonged economic distress; together they are a lethal combination. High P/Es reflect high investor expectations for the economy. Economic blues such as runaway inflation, severe deflation, declining or stagnating earnings, or a combination of these things sour these high expectations. Instead of an above-average economy, investors wake up to an economy that is below average. Presto, a bear market has started.
Let's examine the only secular bear market in the twentieth century in the United States: the period of the Great Depression. P/Es declined from 19 to 9, at a rate of about 12.5 percent a year, and earnings growth was not there to soften the blow, since earnings declined 28.1 percent a year. Thus stock prices declined by 37.5 percent a year!
Ironically – and this really tells you how subjective is this whole "science" that we call investing – the stock market decline from 1929 to 1932 doesn't fit into a "secular" definition, since it lasted less than five years. Traditional, by-the-book, secular markets should last longer than five years. I still put the Great Depression into the secular category, as it changed investor psyches for generations. Also, it was a very significant event: stocks declined almost 90 percent, and 80 years later we are still talking about it.
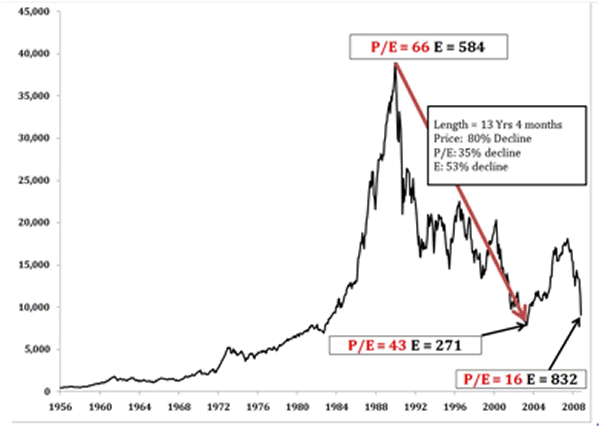
However, a true, by-the-book, long-term bear market took place in Japan (take a look at the next chart). Starting in the late 1980s, over a 14-year period, Japanese stocks declined 8.2 percent a year. This decline was driven by a complete collapse of both earnings – which declined 5.3 percent a year – and P/Es, which declined 3 percent a year. Japanese stocks were in a bear market because stocks were expensive, and earnings declined over a long period of time. In bear markets both P/Es and earnings decline.
In sideways markets P/E ratios decline. They say that payback is a *****, and that is what sideways markets are all about: investors pay back in declining P/Es for the excess returns of the preceding bull market.
Let's move to a slightly cheerier subject: the bull market. We see a great example of a secular bull market in the 1982–2000 period. Earnings grew about 6.5 percent a year and P/Es rose from very low levels of around 10 to the unprecedented level of 30, adding another 7.7 percent to earnings growth. Add up the positive numbers and you get super-juicy compounded stock returns of 14.7 percent a year. Sprinkle dividends on top and you have incredible returns of 18.2 percent over almost two decades. No surprise that the stock market became everyone's favorite pastime in the late 1990s.
The Price of Humanity
Is 100 years of data enough to arrive at any kind of meaningful conclusion about the nature of markets? Academics would argue that we'd need thousands of years' worth of stock market data to come to a statistically significant conclusion. They would be right, but we don't have that luxury. I am not making an argument that sideways markets follow bull markets based on statistical significance; I simply don't have enough data for that.
Most of the time common stocks are subject to irrational and excessive price fluctuations in both directions as the consequence of the ingrained tendency of most people to speculate or gamble . . . to give way to hope, fear and greed.
–Benjamin Graham
As the saying goes, the more things change the more they remain the same. Whether a trade is submitted by telegram, as was done at the turn of the twentieth century, or through the screen of an online broker, as is the case today, it still has a human originating it. And all humans come with standard emotional equipment that is, to some degree, predictable. Over the years we've become more educated, with access to fancier, faster, and better financial tools. A myriad of information is accessible at our fingertips, with speed and abundance that just a decade ago was available to only a privileged few.
Despite all that, we are no less human than we were 10, 50, or 100 years ago. We behave like humans, no matter how sophisticated we become. Unless we completely delegate all our investment decision making to computers, markets will still be impacted by human emotions.
The following example highlights the psychology of bull and cowardly lion markets:
During a bull market stock prices go up because earnings grow and P/Es rise. So in the absence of P/E change, stocks would go up by, let's say, 5 percent a year due to earnings growth. But remember, in the beginning stages of a bull market P/Es are depressed, thus the first phase of P/E increase is normalization, a journey towards the mean; and as P/Es rise they juice up stock returns by, we'll say, 7 percent a year. So stocks prices go up 12 percent (5 percent due to earnings growth and 7 percent due to P/E increase), and that is without counting returns from dividends. After a while investors become accustomed to their stocks rising 12 percent a year. At some point, though, the P/E crosses the mean mark, and the second phase kicks in: the P/E heads towards the stars. A new paradigm is born: 12-percent price appreciation is the "new average," and the phrase "this time is different" is heard across the land.
Fifty or 100 years ago, "new average" returns were justified by the advancements of railroads, electricity, telephones, or efficient manufacturing. Investors mistakenly attributed high stock market returns that came from expanding P/Es to the economy, which despite all the advancements did not turn into a super - fast grower.
In the late 1990s, during the later stages of the 1982–2000 bull market, similar observations were made, except the names of the game changers were now just-in-time inventory, telecommunications, and the Internet. However, it is rarely different, and never different when P/E increase is the single source of the supersized returns. P/Es rose and went through the average (of 15) and far beyond. Everybody had to own stocks. Expectations were that the "new average" would persist – 12 percent a year became your birthright rate of return.
P/Es can shoot for the stars, but they never reach them. In the late stage of a secular bull market P/Es stop rising. Investors receive "only" a return of 5 percent from earnings growth – and they are disappointed. The love affair with stocks is not over, but they start diversifying into other asset classes that recently provided better returns (real estate, bonds, commodities, gold, etc.).
Suddenly, stocks are not rising 12 percent a year, not even 5 percent, but closer to zero – P/E decline is wiping out any benefits from earnings growth of 5 percent and the "lost decade" (or two) of a sideways market has begun.
This Time Is Not Different
I've done a few dozen presentations on the sideways markets since 2007. I've found that people are either very happy or extremely unhappy with this sideways market argument. The different emotional responses had nothing to do with how I dressed, but they correlated with the stock-market cycle we were in at the time of the presentation.
In 2007, when everyone thought we were in a new leg of the 1982 bull market, I was glad that eggs were not served while I presented my sideways thesis, for surely they would have been thrown at me. In late 2008 and early 2009, my sideways market message was a ray of sunlight in comparison to the Great Depression II mood of the audience.
Every cyclical bull market is perceived as the beginning of the next secular bull market, while every cyclical bear market is met with fear that the next Great Depression is upon us. Over time stocks become incredibly cheap again and their dividend yields finally become attractive. The sideways market ends, and a bull market ensues.
Where You Stand Will Determine How Long You Stand
The stock market seems to suffer from some sort of multiple personality disorder. One personality is in a chronic state of extreme happiness, and the other suffers from severe depression. Rarely do the two come to the surface at once. Usually one dominates the other for long periods of time. Over time, these personalities cancel each other out, so on average the stock market is a rational fellow. But rarely does the stock market behave in an average manner.
Among the most important concepts in investing is mean reversion, and unfortunately it is often misunderstood. The mean is the average of a series of low and high numbers – fairly simple stuff. The confusion arises in the application of reversion to the mean concept. Investors often assume that when mean reversion takes place the figures in question settle at the mean, but it just ain't so.
Although P/Es may settle at the mean, that is not what the concept of mean reversion implies; rather, it suggests tendency (direction) of a movement towards the mean. Add human emotion into the mix and P/Es turn into a pendulum – swinging from one extreme to the other (just as investors' emotions do) while spending very little time in the center. Thus, it is rational to expect that a period of above-average P/Es should be followed by a period of below-average P/Es and vice versa.
Since 1900, the S&P 500 traded on average at about 15 times earnings. But it spent only a quarter of the time between P/Es of 13 and 17 – the "mean zone," two points above and below average. In the majority of cases the market reached its fair valuation only in passing from one irrational extreme to the other.
Mean reversion is the Rodney Dangerfield of investing: it gets no respect. Mean reversion is as important to investing as the law of gravity is to physics. As long as humans come equipped with the standard emotional equipment package, market cycles will persist and the pendulum will continue to swing from one extreme to the other.
John F. Mauldin
johnmauldin@investorsinsight.com
John Mauldin, Best-Selling author and recognized financial expert, is also editor of the free Thoughts From the Frontline that goes to over 1 million readers each week. For more information on John or his FREE weekly economic letter go to: http://www.frontlinethoughts.com/learnmore
To subscribe to John Mauldin's E-Letter please click here:http://www.frontlinethoughts.com/subscribe.asp
Copyright 2011 John Mauldin. All Rights Reserved
Note: John Mauldin is the President of Millennium Wave Advisors, LLC (MWA), which is an investment advisory firm registered with multiple states. John Mauldin is a registered representative of Millennium Wave Securities, LLC, (MWS), an FINRA registered broker-dealer. MWS is also a Commodity Pool Operator (CPO) and a Commodity Trading Advisor (CTA) registered with the CFTC, as well as an Introducing Broker (IB). Millennium Wave Investments is a dba of MWA LLC and MWS LLC. Millennium Wave Investments cooperates in the consulting on and marketing of private investment offerings with other independent firms such as Altegris Investments; Absolute Return Partners, LLP; Plexus Asset Management; Fynn Capital; and Nicola Wealth Management. Funds recommended by Mauldin may pay a portion of their fees to these independent firms, who will share 1/3 of those fees with MWS and thus with Mauldin. Any views expressed herein are provided for information purposes only and should not be construed in any way as an offer, an endorsement, or inducement to invest with any CTA, fund, or program mentioned here or elsewhere. Before seeking any advisor's services or making an investment in a fund, investors must read and examine thoroughly the respective disclosure document or offering memorandum. Since these firms and Mauldin receive fees from the funds they recommend/market, they only recommend/market products with which they have been able to negotiate fee arrangements.
Opinions expressed in these reports may change without prior notice. John Mauldin and/or the staffs at Millennium Wave Advisors, LLC and InvestorsInsight Publishing, Inc. ("InvestorsInsight") may or may not have investments in any funds cited above.
Disclaimer PAST RESULTS ARE NOT INDICATIVE OF FUTURE RESULTS. THERE IS RISK OF LOSS AS WELL AS THE OPPORTUNITY FOR GAIN WHEN INVESTING IN MANAGED FUNDS. WHEN CONSIDERING ALTERNATIVE INVESTMENTS, INCLUDING HEDGE FUNDS, YOU SHOULD CONSIDER VARIOUS RISKS INCLUDING THE FACT THAT SOME PRODUCTS: OFTEN ENGAGE IN LEVERAGING AND OTHER SPECULATIVE INVESTMENT PRACTICES THAT MAY INCREASE THE RISK OF INVESTMENT LOSS, CAN BE ILLIQUID, ARE NOT REQUIRED TO PROVIDE PERIODIC PRICING OR VALUATION INFORMATION TO INVESTORS, MAY INVOLVE COMPLEX TAX STRUCTURES AND DELAYS IN DISTRIBUTING IMPORTANT TAX INFORMATION, ARE NOT SUBJECT TO THE SAME REGULATORY REQUIREMENTS AS MUTUAL FUNDS, OFTEN CHARGE HIGH FEES, AND IN MANY CASES THE UNDERLYING INVESTMENTS ARE NOT TRANSPARENT AND ARE KNOWN ONLY TO THE INVESTMENT MANAGER.
John Mauldin Archive |
© 2005-2022 http://www.MarketOracle.co.uk - The Market Oracle is a FREE Daily Financial Markets Analysis & Forecasting online publication.