Stock Market Real Negative Returns for the Next Decade, Bear Market in PEs
Stock-Markets / Stock Market Valuations Feb 07, 2011 - 06:02 AM GMTBy: Mike_Shedlock
 Market cheerleaders keep ratcheting up expected earnings, failing to note that much of the recent earnings growth is simply not sustainable.
Reasons for Unsustainable Earnings Growth
- Much of the recent earnings growth is directly related to federal stimulus that will eventually end.
- Much of the earnings in the financial sector are a mirage, based on assets not marked-to-market and insufficient loan loss reserves. The Fed and the FASB have repeatedly postponed rules changes for the benefit of banks and other financial institutions.
- Earnings in both the financial and nonfinancial sectors have margins outside historical norms, based on very low headcounts and outsourcing.
Nonetheless, let's ignore the above factors and assume earnings will keep rising. Does that mean the stock market will go up, or is even likely to go up on a sustainable basis?
Stock Market Cycles and PE Ratios
Crestmont provides stock market returns and PE Ratios, for every year going forward, from every year since 1900.
- Nominal Returns (not inflation adjusted), including dividends (reinvested), transaction costs, and taxes paid: S&P 500 Nominal Returns + Dividends
- Nominal Returns (not inflation adjusted), without dividends, transaction costs, or taxes: S&P 500 Nominal Returns
- Real Returns (inflation adjusted), including dividends (reinvested), transaction costs, and taxes paid: S&P 500 Real Returns Including Dividends
The matrix tables listed above are for taxable accounts. Crestmont also provides matrix tables for tax-exempt accounts.
The concept may be hard to visualize until you see it, but as word of warning I have a 24 inch monitor and the matrix tables will not come close to fitting on my screen. To read the text and numbers in the PDFs, you will need to enlarge the size making it impossible to see the entire table at once.
Nonetheless, please open up one of the above tables to get an idea of their size. The diagonal black line running through each table is a 20 year-line.
Essential Ideas
- In spite of what efficient market theorists say, for a period of at least 20 years, it very much matters whether the starting valuation (PE) is high or low when one starts to invest.
- However, in any given year (or even for several years), stock market returns may do random things. In other words, just because a market is richly valued does not mean it cannot get more so. Likewise, just because a market is cheaply valued, does not mean it cannot get cheaper.
- As a result of the preceding point, many think that returns are random. While that may be true in a given year, over a sufficient period of time, expected future returns are anything but random.
- The stock market fluctuates over long periods of time, between low and high PE valuations. Those cycles can last 20 years, and in that timeframe, people are apt to forget or ignore long-term cycles of PE expansion and PE compression.
- The bulk of stock market gains frequently come from PE expansion, not from improved earnings.
- It is important to know where in the cycle one is (whether PEs are in a state of expansion or contraction).
It is invalid to exclude dividends, so I used the matrix (nominal returns + dividend) as the starting point for the following tables and analysis.
The table below shows a sampling of years (some high valuation years and some low) along with annualized returns for two decades.
Annualized Rates of Return for Select Years
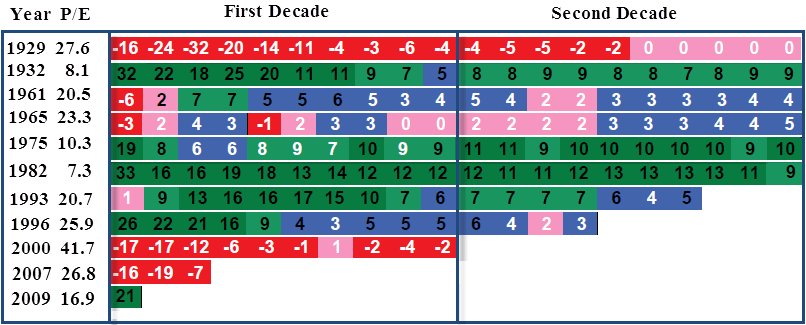
Note how much the starting PE valuation matters. Someone who started investing in 1929 received an annualized rate-of-return of 0% for two full decades, even if they religiously reinvested dividends every year.
However, someone investing in 1982 received an excellent annualized rate-of-return for two full decades (12% for the first decade and 9% annualized for 20 years).
Note year 2000. Starting valuations were the highest in history. It should not have been a surprise to discover that 10 years later, the annualized rate-of-return was -2%.
Bear in mind, the Case-Shiller normalized PE for the year ending 2010 is 23. Does that bode well for the next decade?
Of course no one knows what this year or next year will bring.
Take a look at 1996 in the above table. In spite of several years of huge stock market gains, the annualized rate-of-return to date sits at 3.
Cycles of PE Compression and Expansion

Over long periods of time PE ratios tend to compress and expand. Unless "it's different this time", history says that we are in a secular downtrend in PEs. From 1983 until 2000, investors had the tailwinds PE expansion at their back. Since 2000, PEs fluctuated but the stock market never returned to valuations that typically mark a bear market bottom.
Moreover, demographically speaking, the current decade not only starts with very rich valuations, but also comes at a time when peak earnings of boomers have passed. Those boomers are now heading into retirement and will need to draw down savings, not accumulate large houses and more toys.
Of course, the market can of course do anything this year (or the next few years), but history strongly suggests that stock market returns for the next 10 years will be lean years, perhaps negative years.
Annualized Rates-of-Return Starting PE Above 21
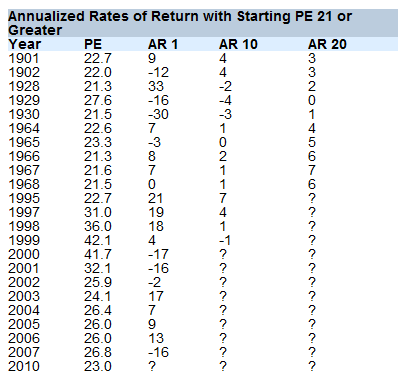
The following table shows annualized rates-of-return for the current year, the 10th year, and the 20th year for each year in which the PE started at 21 or higher.
Variance over Time
- The first year rate-of-return ranges from -30 to +33.
- The annualized rate-of-return for the first decade ranges from -4 to +7.
- The median rate-of-return for the first decade is +1.
Annualized Rates-of-Return Starting PE Less Than 13
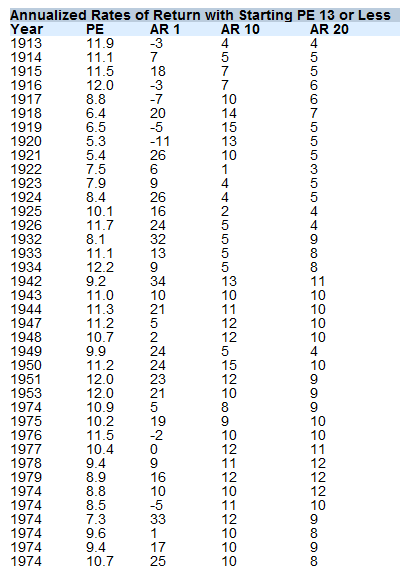
The following table shows annualized rates-of-return for the current year, the 10th year, and the 20th year for each year in which the PE started at 13 or lower.
Variance over Time
- The first year rate-of-return ranges from -11 to +34.
- The annualized rate-of-return for the first decade ranges from +4 to +15.
- The median rate-of-return for the first decade is +10.
Valuations Matter in the Long Run
Please consider the following snip is from the Sitka Pacific 2010 Annual Review.
Depending on how closely you follow the financial markets, it may be surprising to learn that profits are at new highs even though stock prices, as measured by the S&P 500, are still 20% below their highs. In other words, new highs in profits haven’t translated into new highs in stock prices. If we go back even further, after-tax corporate profits soared 175% from the first quarter of 2000 through the second quarter of 2010. However, during that same time, stock prices fell roughly 15%.
In fact, there is nothing novel about a period of falling stock prices and rising earnings. Since the end of World War II, corporate profits have more or less trended continuously higher, with only minor interruptions during recessions. However, stock prices have gone through long periods in which they trended sideways or down, even though earnings continued to rise. From 1966 to 1980 after-tax corporate earnings rose 244%, but the price of the S&P 500 rose only 18% during that period. In contrast, earnings grew only 112% during the next 14 years from 1980 to 1994, but the S&P 500 rose 327% over that time.
Although very short-term returns are influenced by corporate earnings, beyond the short-term it is not trends in earnings but valuations and trends in valuations that determine stock market returns. In short, when valuations are low and increasing, long-term stock market returns are high. When valuations are high and decreasing, long-term stock market returns are low—even negative at times of peak valuations.
There are many ways to measure the valuation of the stock market, but relatively few ways that have value when they are applied across many types of bull and bear markets. Over the past year we have focused on the price-to-earnings measure popularized by economist Robert Shiller, which uses a 10-year average of earnings. Since earnings have at times fluctuated wildly in the short run, a 10-year average captures a much more reliable snapshot of the long-term profitability of public companies.
As you probably know, the stock market peak 10 years ago was the largest bubble in this country’s history. Previous bull markets ended with a 10-year P/E ratio in the 23–33 range, with the high point being the peak in 1929 at 33, just prior to the Great Depression. However, the bull market that ended in 2000 recorded a peak 10-year P/E ratio of 44, a valuation that was 33% higher than in 1929.
To really understand on a practical level how high valuations were at the peak in 2000, it helps to look at market returns from different valuation levels before the bubble in the 1990s. The chart below has a blue dot for every month from 1881 through 1990. The horizontal axis at the bottom shows the 10-year P/E of the S&P Composite during that month, and the vertical axis to the left shows the subsequent 20-year inflation adjusted return of the market.
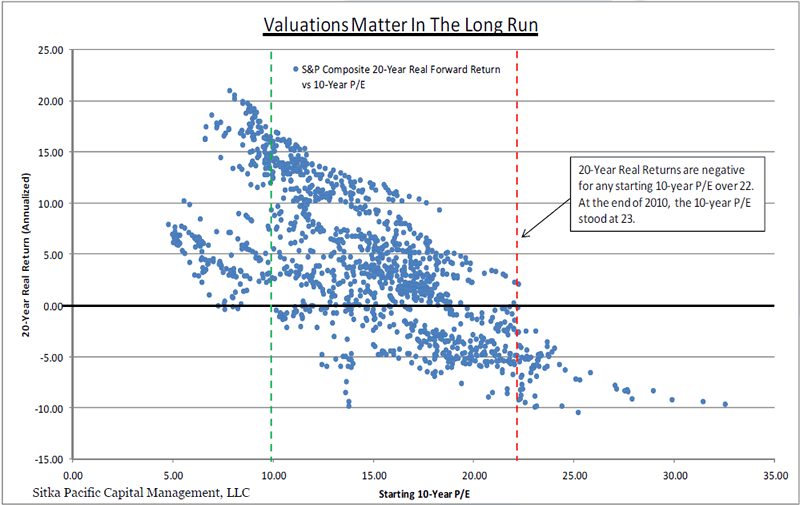
Prior to 1990, each month in which the 10-year P/E was under 10 (to the left of the green line) had a positive inflation-adjusted return over the next 20 years. That means that at those low valuations, you could confidently buy-and-hold stocks for the long term and know that the market would beat inflation over time—often by a significant amount.
However, for 10-year P/E ratios above 22 (to the right of the red line), there is not a single month between 1881 and 1990 in which the market had a positive inflation-adjusted return in the subsequent 20 years. And for P/E ratios above 25, past returns have approached −10% annualized, a rate of return that gives an 88% inflation-adjusted loss over 20 years.
Since 1995, the market had been above 10-year P/E valuations of 22 for 13 consecutive years, until July 2008. After a brief decline in 2009 into valuations that would be considered “average” historically, the market ended 2010 with a 10-year P/E of 23. Although this is about half of the peak valuation in 2000, it is still above valuation levels that have produced positive inflation-adjusted returns in the past.
With a peak 10-year P/E ratio of 44 in 2000, it is no mystery why returns over the past decade have been poor. On a consumer price index adjusted basis, the S&P 500 ended last year 31% below its 2000 peak, for an annualized return of −3%. Although we’ll have to wait another 10 years to see the S&P 500’s 20-year inflation-adjusted return from its record P/E of 44, it is almost certain to be a negative number, and probably a large negative number.
Notes:
- The above chart was produced from the Crestmont data: Real Returns (inflation adjusted), including dividends (reinvested).
- The PE of 44 mentioned above is a midyear high and thus differs slightly from the tables I created.
- To reiterate the key take-away from the above chart: 20-year real returns are negative for any starting 10-year PE over 22. At the end of 2010, the 10-year PE was 23.
History shows that stock market valuations range from extremely cheap (10-year normalized PEs near 10 to extremely overvalued, 10-year normalized PEs of 44). Peak to trough changes in valuation occur over long periods as the market goes from one extreme to another.
Here is another chart looks at things from the point of view of PE compression (stocks moving from extremely overvalued conditions to extremely undervalued conditions).
Bear Market in PEs
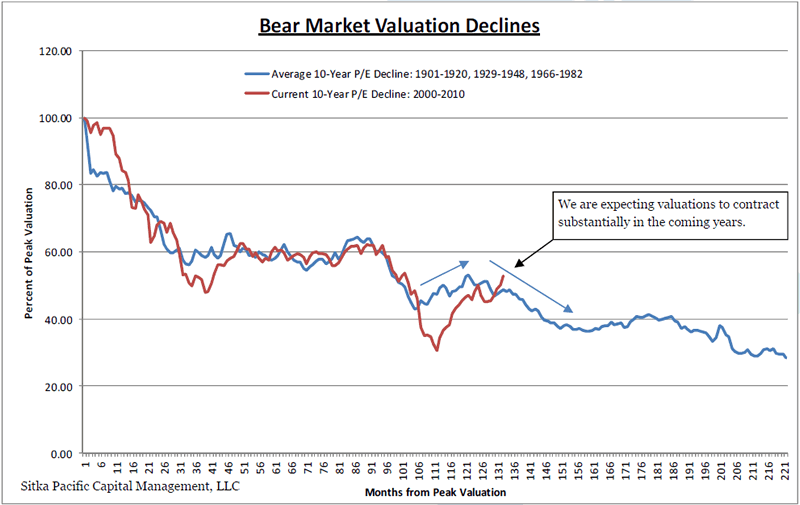
The 10-Year PE declined from 44 in 2000 (the richest valuation ever), to a current valuation of 23. That is about a 47% decline in the PE ratio, yet as discussed above, a PE of 23 is a very rich valuation.
When PE valuations are declining, and history suggests we are nowhere near the bottom of the PE compression cycle, generating positive returns in the stock market is much like trying to swim upstream.
Even if earnings increase (a dubious point to start with as noted in the beginning of this article), prices will likely be dragged lower by the weight of declining valuations.
Where to From Here?
Hopefully you now realize that expectations of rising earnings being tremendous for the stock market is a fallacious construct. Such talk ignores high valuations, the long-term trend in valuations, and demographics. Moreover, it's debatable if earnings are likely to rise in the first place.
With that in mind, people chasing this market as well as those fully invested do not realize how lucky they have been.
Last week I received an email from someone who fears being out the market. I heard the same thing in 2007. I suggest people ought to fear being fully invested with no hedges. The same applies to pension funds. Note that most pension plan assumptions are on the order of 8% annualized rates-of return, and pension funds are typically 100% invested, 100% of the time.
However, I do not know where the market is headed this year, nor does anyone else. 2011 may turn out like 1998 or it may turn out like 2008.
Either way, history strongly suggests that 10-year and 20-year returns looking ahead are likely to be low, if not negative.
Investing, like life, is a marathon not a sprint. Sometimes the prudent thing to do is sit on the sidelines waiting for better opportunities, even if it means enduring cat-calls and taunts from those who do not have any understanding of risk or history.
Click Here To Scroll Thru My Recent Post ListBy Mike "Mish" Shedlock
http://globaleconomicanalysis.blogspot.com
Mike Shedlock / Mish is a registered investment advisor representative for SitkaPacific Capital Management . Sitka Pacific is an asset management firm whose goal is strong performance and low volatility, regardless of market direction.
Visit Sitka Pacific's Account Management Page to learn more about wealth management and capital preservation strategies of Sitka Pacific.
I do weekly podcasts every Thursday on HoweStreet and a brief 7 minute segment on Saturday on CKNW AM 980 in Vancouver.
When not writing about stocks or the economy I spends a great deal of time on photography and in the garden. I have over 80 magazine and book cover credits. Some of my Wisconsin and gardening images can be seen at MichaelShedlock.com .
© 2011 Mike Shedlock, All Rights Reserved.
© 2005-2022 http://www.MarketOracle.co.uk - The Market Oracle is a FREE Daily Financial Markets Analysis & Forecasting online publication.


