


Stock Market Elliott Wave Analysis and Forecast for Week Starting 7th Feb
Stock-Markets / Stock Markets 2011 Feb 07, 2011 - 02:51 AM GMTBy: Tony_Caldaro

 The market again recovered from an end of month decline to start a new month off in positive fashion. This has been an ongoing theme during this seven month uptrend. Economic reports for the week were quite good: 13 positive and 3 negative. On the negative side, monthly Payrolls came in lower than expected, construction spending and the M1 multiplier both declined. On the positive side, ISM manufacturing/services improved, along with the Chicago PMI, monthly auto sales, factory orders, personal income/spending, PCE prices, Q4 productivity, the ADP, weekly jobless claims, unemployment, the WLEI and the monetary base.
For the week the SPX/DOW were +2.5%, and the NDX/NAZ were +3.1%. Asian markets gained 0.9%, European markets gained 1.5%, the Commodity equity group gained 0.9%, and the DJ World index rose 2.0%. Bonds lost 2.1%, Crude was -0.6%, Gold gained 1.0% and the USD was -0.1%. Next week, the key reports will be the twin deficits budget/trade, and consumer sentiment.
LONG TERM: bull market
An interesting week. Last friday the market looked like it had topped right at the OEW 1303 pivot when it sold off with the biggest pullback (28 points) since Int. wave five began in early December. On monday the market rebounded a bit to end the month of January. Then it took off to new uptrend highs to start the month of February. Similar events had occurred earlier in this seven month uptrend, i.e. during the end of August/early September, and the end of November/early December. Since the Primary II July low at SPX 1011 this uptrend has come close to a downtrend confirmation three times. And, all three times it was avoided.
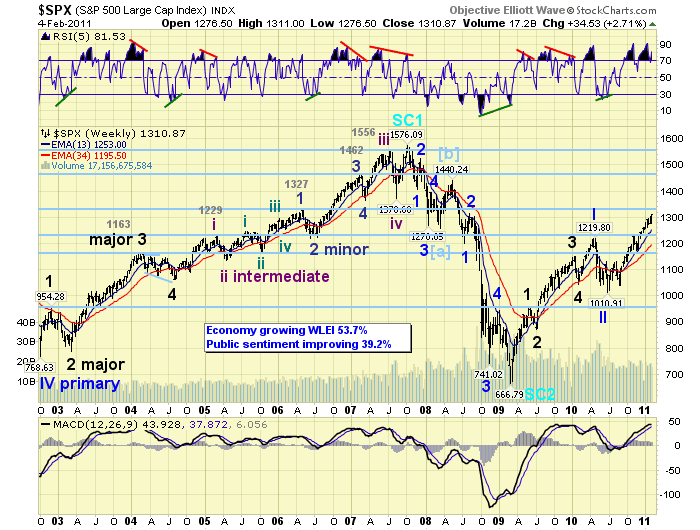
Longer term the bull market continues to unfold as anticipated. This five Primary wave bull market should end in early 2012 with a retest of the 2007 highs, or higher. The first two Primary waves have already completed: Primary I at SPX 1220 in Apr10 and Primary II at SPX 1011 in July10. Primary wave III started to rise after that low. We have been expecting Primary wave III to unfold with five Major waves, just like Primary wave I. Our target for Major wave 1 of Primary III, the current uptrend, was the OEW 1313 pivot in Jan11. The market hit this pivot on February first. Mission accomplished!
MEDIUM TERM: uptrend high SPX 1311
This uptrend has risen for seven months and is now up 29.7% from the July10 low. This is quite a rally to kick off Primary wave III. During this advance the market has experienced three significant pullbacks: the first one occurred in August at -7.9%, the second in November and was -4.4%, and the third in January which was only -2.1%. Each time the market came close to confirming a downtrend only to avoid it with a rally at the beginning of the following month. Notice the pullbacks have become progressively smaller as the uptrend has unfolded.
As a result of the recent activity we had to look for other potential wave structure scenarios that would fit the current market activity. On tuesday night we offered four potential counts going forward. The first two are posted on the SPX hourly chart, and the other two on the DOW and NDX daily charts respectively. You can review that special update on the blog. For now, we continue with the conservative, and targeted approach, of an uptrend top within the OEW 1313 pivot range (SPX 1306-1320). We have maintained the uptrend count as five Intermediate waves forming Major wave 1: Int. one SPX 1127 Aug10, Int. two SPX 1040 Aug10, Int. three SPX 1229 Nov10, Int. four SPX 1173 Nov10, and Int. five underway. A slight deviation from this count suggests that the SPX 1303 high did indeed end Major wave 1, and the activity since then has been an irregular top, with a small wave A at SPX 1275, and a small wave B underway now. In either scenario the SPX should not break through the OEW 1313 pivot range. Should it accomplish this in the days and weeks ahead then the DOW/NDX waves counts would come into play.
SHORT TERM
Support for the SPX remains at 1303 and then 1291, with resistance at 1313 and then 1363. Short term momentum ended the week overbought. Our preferred count, noted above, suggests Minor wave 5 continues to unfold. This is the fifth and final wave of Intermediate wave five, and the fifth and final wave of the Major wave 1 uptrend. Technically the uptrend remains positive as all nine sectors of the SPX are still in uptrends. Usually we start to see some weakness in these sectors as a top forms. In world markets only three of the fifteen indices we track are in downtrends, another positive. The weekly RSI/MACD indicators look good, but the daily indicators are displaying negative divergences at the recent highs. For now, the uptrend remains in place as this market continues to work its way higher without any downtrend confirmations by OEW.
Support is at the 1303 and 1291 pivots, with short term support around 1300. Uptrend support is at the OEW 1261 pivot. A break of this pivot would likely confirm a downtrend. Overhead resistance is at the current 1311 high and the OEW 1313 pivot range. A breakout above this pivot will likely lead to a rally to the next pivot at SPX 1363. Therefore, there is a lot at stake with the near term market action over the coming days and weeks. Best to your trading!
FOREIGN MARKETS
Asian markets were mostly higher and gained 0.9% on the week. India’s BSE and China’s SSEC remain in downtrends.
European markets were all higher and gained 1.5% for the week. All remain in uptrends.
The Commodity equity group were mixed on the week gaining 1.0%. Only Brazil’s BVSP is in a downtrend.
The uptrending DJ World index gained 2.0% on the week.
COMMODITIES
Bonds lost 2.1% on the week and are in another downtrend. This asset class has been quite choppy in recent weeks and yields may need to move higher again.
Crude is uptrending and but lost -0.6% on the week. It remains as volatile as always.
Gold gained 1.0% on the week after hitting our support zone last week. The recent rally off the $1308 low looks positive medium term.
The downtrending USD (-0.1%) is trying to get something going on the upside. It put in a nice positive divergence at the 76.88 DXY low, but also experienced some choppiness between November and January. Leaning positive here, nevertheless.
NEXT WEEK
A quiet week ahead on the economic front. On monday at 3:00 Consumer credit. The next reports come on thursday with the weekly Jobless claims, Wholesale inventories and the Budget deficit. Then on friday we have the Trade deficit and Consumer sentiment. On wednesday FED chairman Bernanke gives Congressional testimony on the economic outlook and fiscal/monetary policy. On friday night FED governor Raskin gives a speech on mortgage servicing issues in Utah. Best to your weekend and week!
NOTE
This weekend we are heading out for a road trip. Arrangements have been made for internet access during the trip. However, the daily updates might not be as punctual as they usually are, i.e. around 4:10 each day. Will certainly do our best to keep on top of these markets regardless of where we are. Please be patient. Should a problem arise I will definitely post some type of notification on the blog. Thank you for your support.
CHARTS: http://stockcharts.com/def/servlet/Favorites.CServlet?obj=ID1606987
http://caldaroew.spaces.live.com
After about 40 years of investing in the markets one learns that the markets are constantly changing, not only in price, but in what drives the markets. In the 1960s, the Nifty Fifty were the leaders of the stock market. In the 1970s, stock selection using Technical Analysis was important, as the market stayed with a trading range for the entire decade. In the 1980s, the market finally broke out of it doldrums, as the DOW broke through 1100 in 1982, and launched the greatest bull market on record.
Sharing is an important aspect of a life. Over 100 people have joined our group, from all walks of life, covering twenty three countries across the globe. It's been the most fun I have ever had in the market. Sharing uncommon knowledge, with investors. In hope of aiding them in finding their financial independence.
Copyright © 2011 Tony Caldaro - All Rights Reserved Disclaimer: The above is a matter of opinion provided for general information purposes only and is not intended as investment advice. Information and analysis above are derived from sources and utilising methods believed to be reliable, but we cannot accept responsibility for any losses you may incur as a result of this analysis. Individuals should consult with their personal financial advisors.
© 2005-2022 http://www.MarketOracle.co.uk - The Market Oracle is a FREE Daily Financial Markets Analysis & Forecasting online publication.