


Stock Market February Seasonality
Stock-Markets / Sector Analysis Feb 05, 2011 - 12:46 PM GMTBy: John_Hampson

 February is an interesting month by seasonality. Typically the start of six months of underperformance for precious metals and the start of six months of outperformance for oil, it is also the second weakest month of the calendar for stocks.
On this occasion I expect Gold to buck seasonal weakness, given that it has been consolidating for the last 3 months during its seasonally strong time and is now signalling a buy:
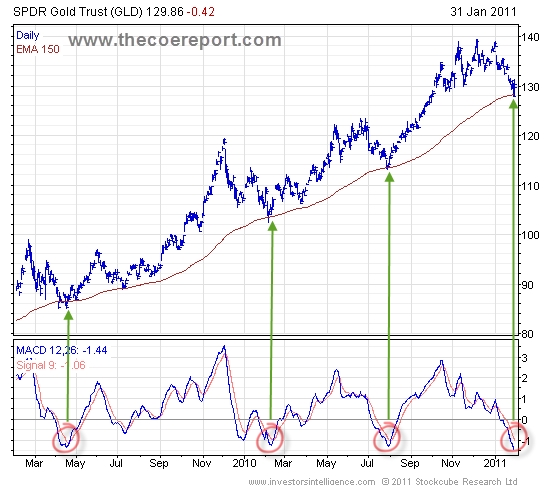
Source: Investors Intelligence
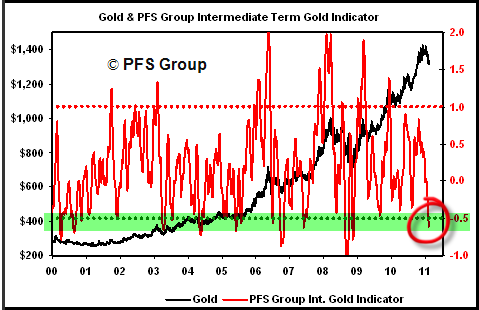
Source: Chris Puplava
Global oil demand is back at all time high levels, and excess stock levels have been diminishing:
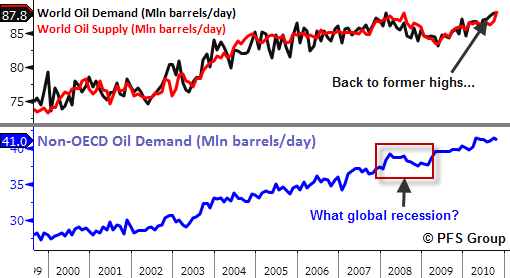
Source: Shortsideoflong / PFS Group
But if anything were to impede crude oil's seasonally strong period, it would be a period of dollar strength, and the dollar may be making a bounce at a key support:
Source: Kimble Charting Solutions
A period of dollar strength could also spell a period of weakness for equities, as the correlation shown here supports:
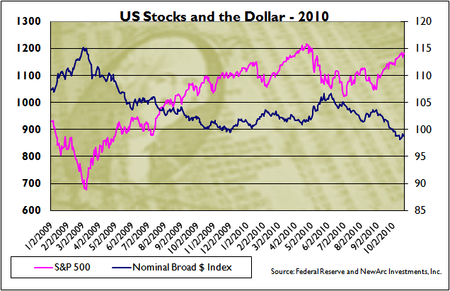
Source: Fed Reserve and Newarc Investments Inc
So let's go back to February being a seasonally weak month for stocks. The charts below reveal specifically a weak second half to the month:
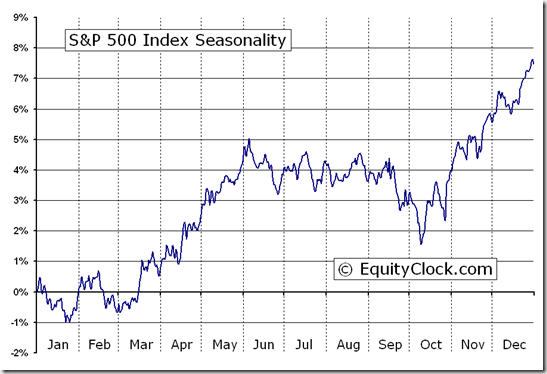
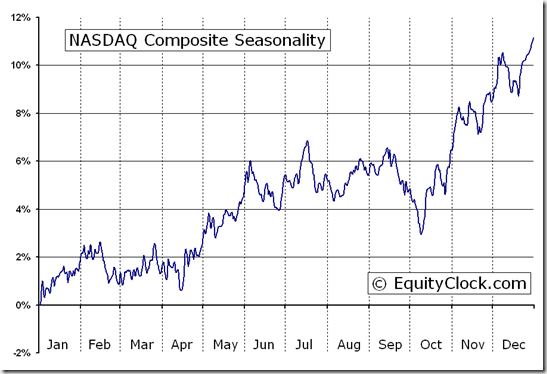
Source both: Equityclock.com
There is a full moon February 18th 2011 and statistically this implies negative pressure for the stock market leading into and around that date. Returns by moon here:
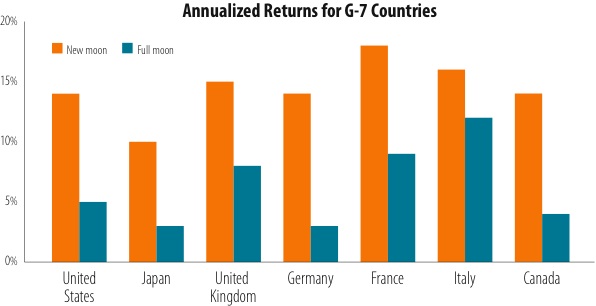
Source: Dichev/Janes
In summary, a seasonally weak second half of February, weakness into and around a full moon 18th February and a potential sustained dollar bounce from here perhaps give the bears some hope of a genuine pullback from what continues to be a largely overbought status (indicators, sentiment).
Could we even see another flash crash (or worse, a "splash crash" as has been termed to imply a rapid and deep fall in many assets not just stocks) as we have arguably experienced a similar overextension in the stock indices? Well, what caused the flash crash? Geomagnetic activity is the surprising answer.
In the days before the US stock market flash crash of May 6th 2010 there was a buildup in solar activity. Then on May 5th, a pair of solar flares bathed Earth's upper atmosphere in X-rays and caused a double-wave of ionization to sweep over the Americas. There is a correlation between geomagnetic activity and depression and suicide in humans, and an increase in psychotic episodes in individuals who already suffer from unstable psychological states. Geomagnetic activity is also shown to make people more irritable and aggressive, and can affect melatonin synthesis, blood pressure, heart disease and light sensitivity.
It should not surprise you therefore that there is a correlation between stock market returns and geomagnetism, as sentiment and mood play a key role in trading, as shown in this chart of normal days versus days of bad geomagnetism:
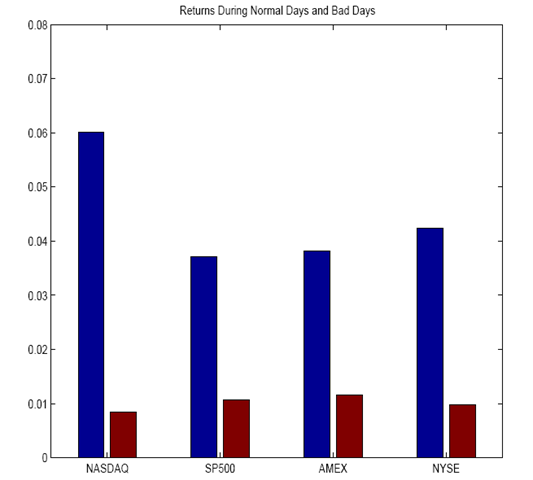
Source: Robotti / Krivelyova
Geomagnetic activity and storms display seasonality, as shown here:

Source: Robotti / Krivelyova
The worst returns for stocks occur in September, October, February and March, closely correlating to peaks in geomagnetism. So keep an eye on the space weather, and forecasts for geomagnetic activity.
In summary, the second half of February could provide a pullback in stocks. However, whilst leading indicators remain positive (ECRI last week 3.5% this week 3.7%), US earnings season continues to deliver a beat rate close to 70 (currently around 68%), bull market sustainability index remains positive up to one year out, stocks remain cheap relative to bonds and QE/Pomo continues, I continue to view any significant pullback as a buying opportunity.
John Hampson
John Hampson, UK / Self-taught full-time trading at the global macro level / Future Studies
www.amalgamator.co.uk / Forecasting By Amalgamation / Site launch 1st Feb 2011
© 2011 Copyright John Hampson - All Rights Reserved
Disclaimer: The above is a matter of opinion provided for general information purposes only and is not intended as investment advice. Information and analysis above are derived from sources and utilising methods believed to be reliable, but we cannot accept responsibility for any losses you may incur as a result of this analysis. Individuals should consult with their personal financial advisors.
© 2005-2022 http://www.MarketOracle.co.uk - The Market Oracle is a FREE Daily Financial Markets Analysis & Forecasting online publication.